Brooklyn Industrial Market Report
Brooklyn Industrial Market Report
Matthews™ Is The Largest Collection of Real Estate Specialists In The Country
We are privately owned and organically grown, promoting a sense of true collaboration, work ethic, and shared data across offices. Our decades of Brooklyn sales experience, combined with the Matthews™ technology platform, branding, and operational support, allows us to build the best team around any assignment, resulting in truly unique marketing strategies that deliver premiums, certainty of closing, and transparency to our clients.
Market Overview
Historically overshadowed by other asset types, industrial in NYC is having its moment with the rise of e-commerce and a supply that diminishes each year due to redevelopment and rezonings. In 2023, industrial was one of Brooklyn’s best-performing assets, with the average price per SF reaching a record high.
- Total dollar volume for the Brooklyn industrial market was approximately $280M.
- 61 industrial buildings above $1M traded in Brooklyn, with an average price per SF
of $445.- Buildings that traded below $5M accounted for 72% of the total transaction volume and traded on average $462 per SF.
- Buildings above $5M traded on average $408 per SF — 12% lower than the below $5M market.
- Users bought 84% of transactions.
- The average deal size was $4.6M.
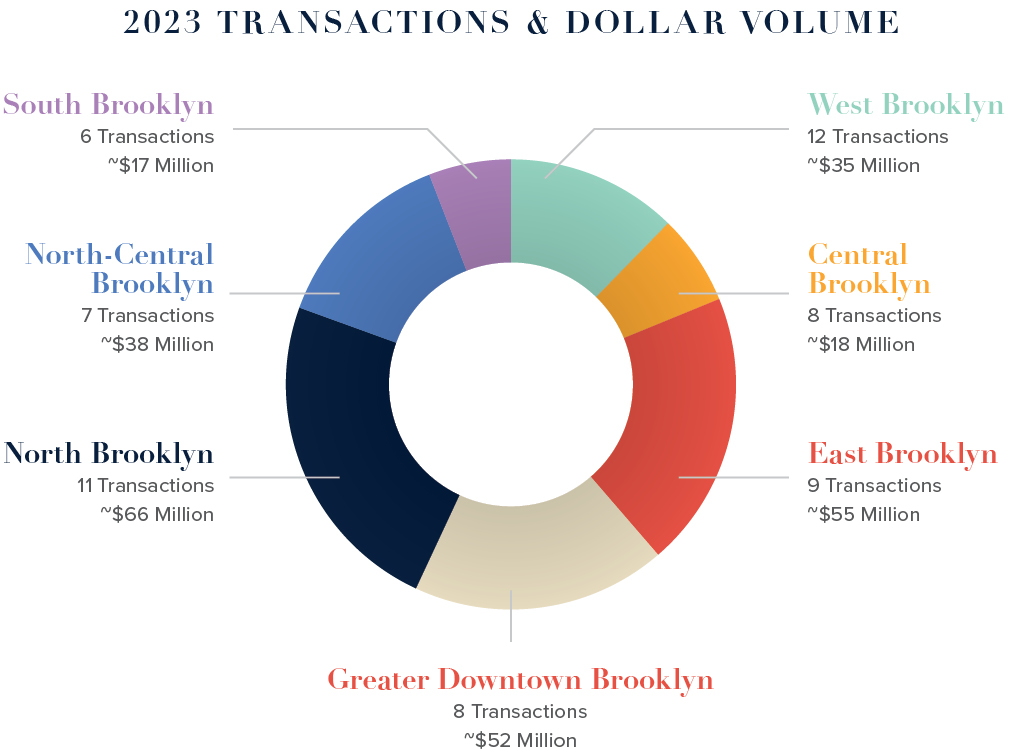
Where Are The Transactions Happening?
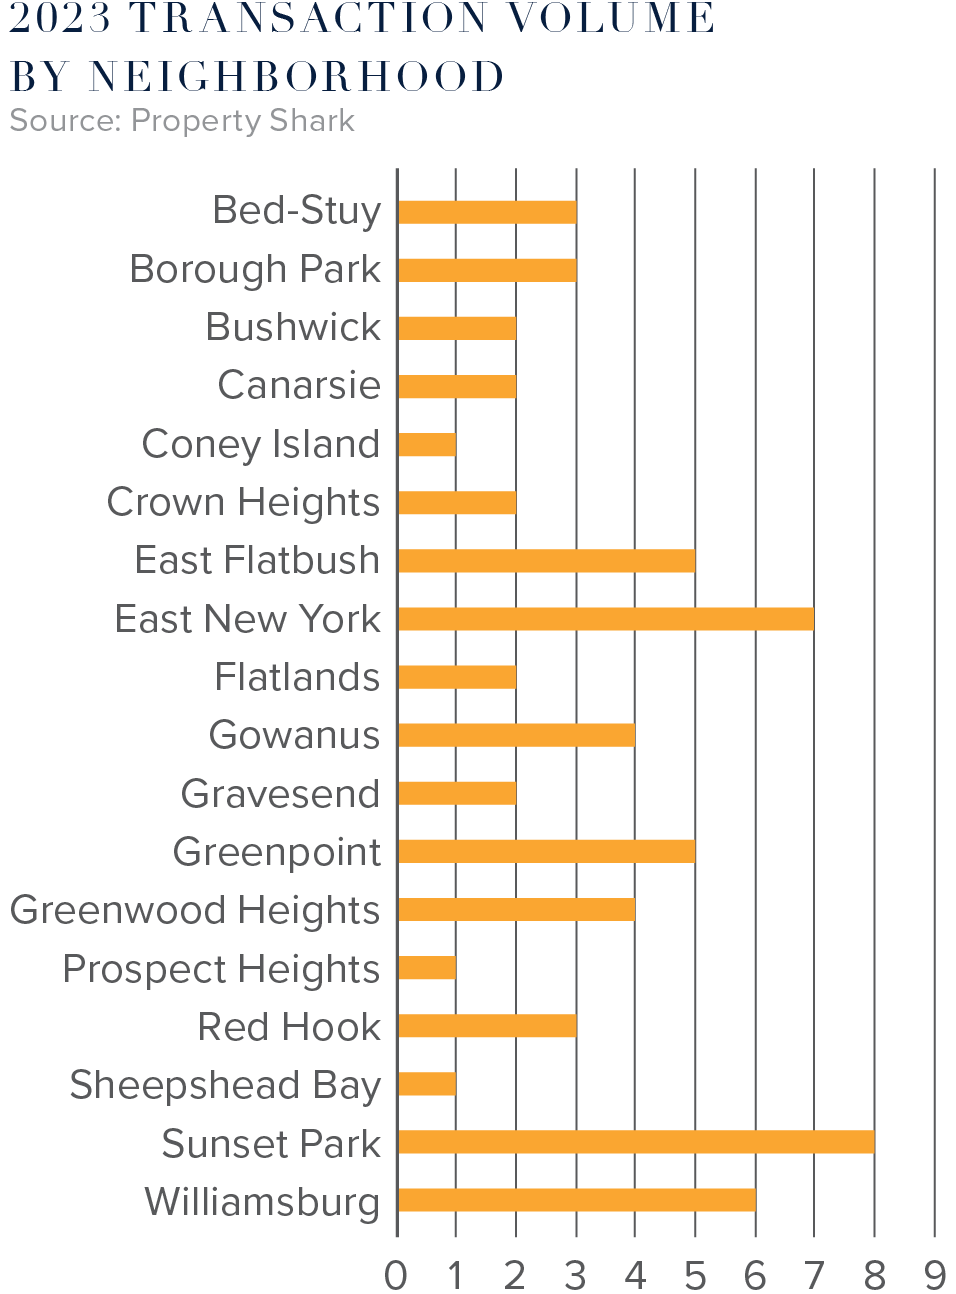
- Sunset Park led all Brooklyn neighborhoods in transaction volume with 8 sales.
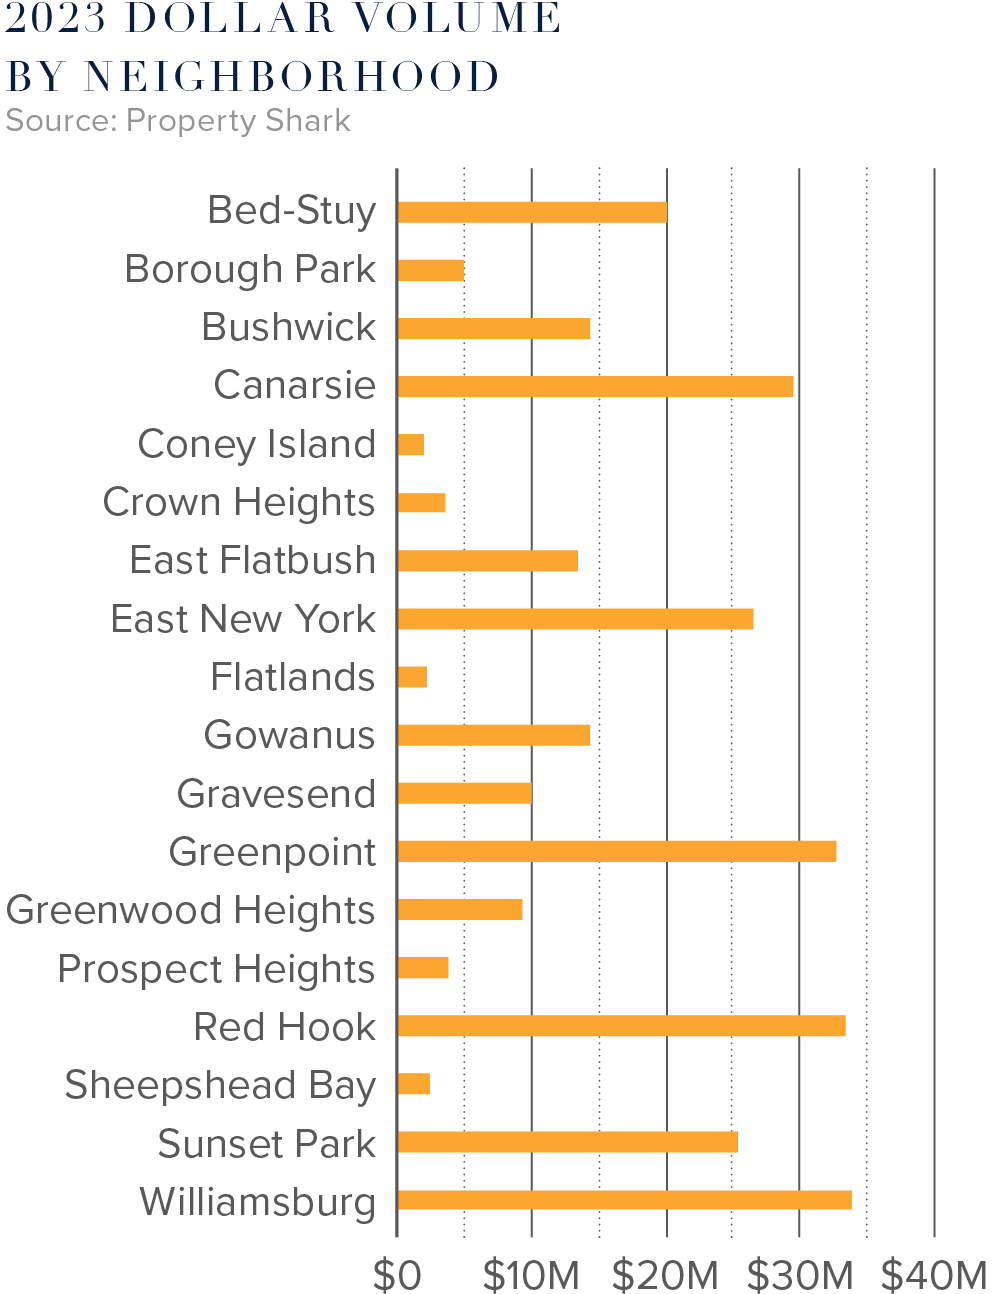
- Williamsburg led all Brooklyn neighborhoods in dollar volume accounting for just under $34M in sales, followed closely by Red Hook and Greenpoint.
- The biggest transaction of 2023 was in Canarsie and sold for $28M — an 88,000 SF warehouse with a 55-car parking lot.