Unlocking Multi-Tenant Velocity
Navigating the Impact of Interest Rates Across Eras
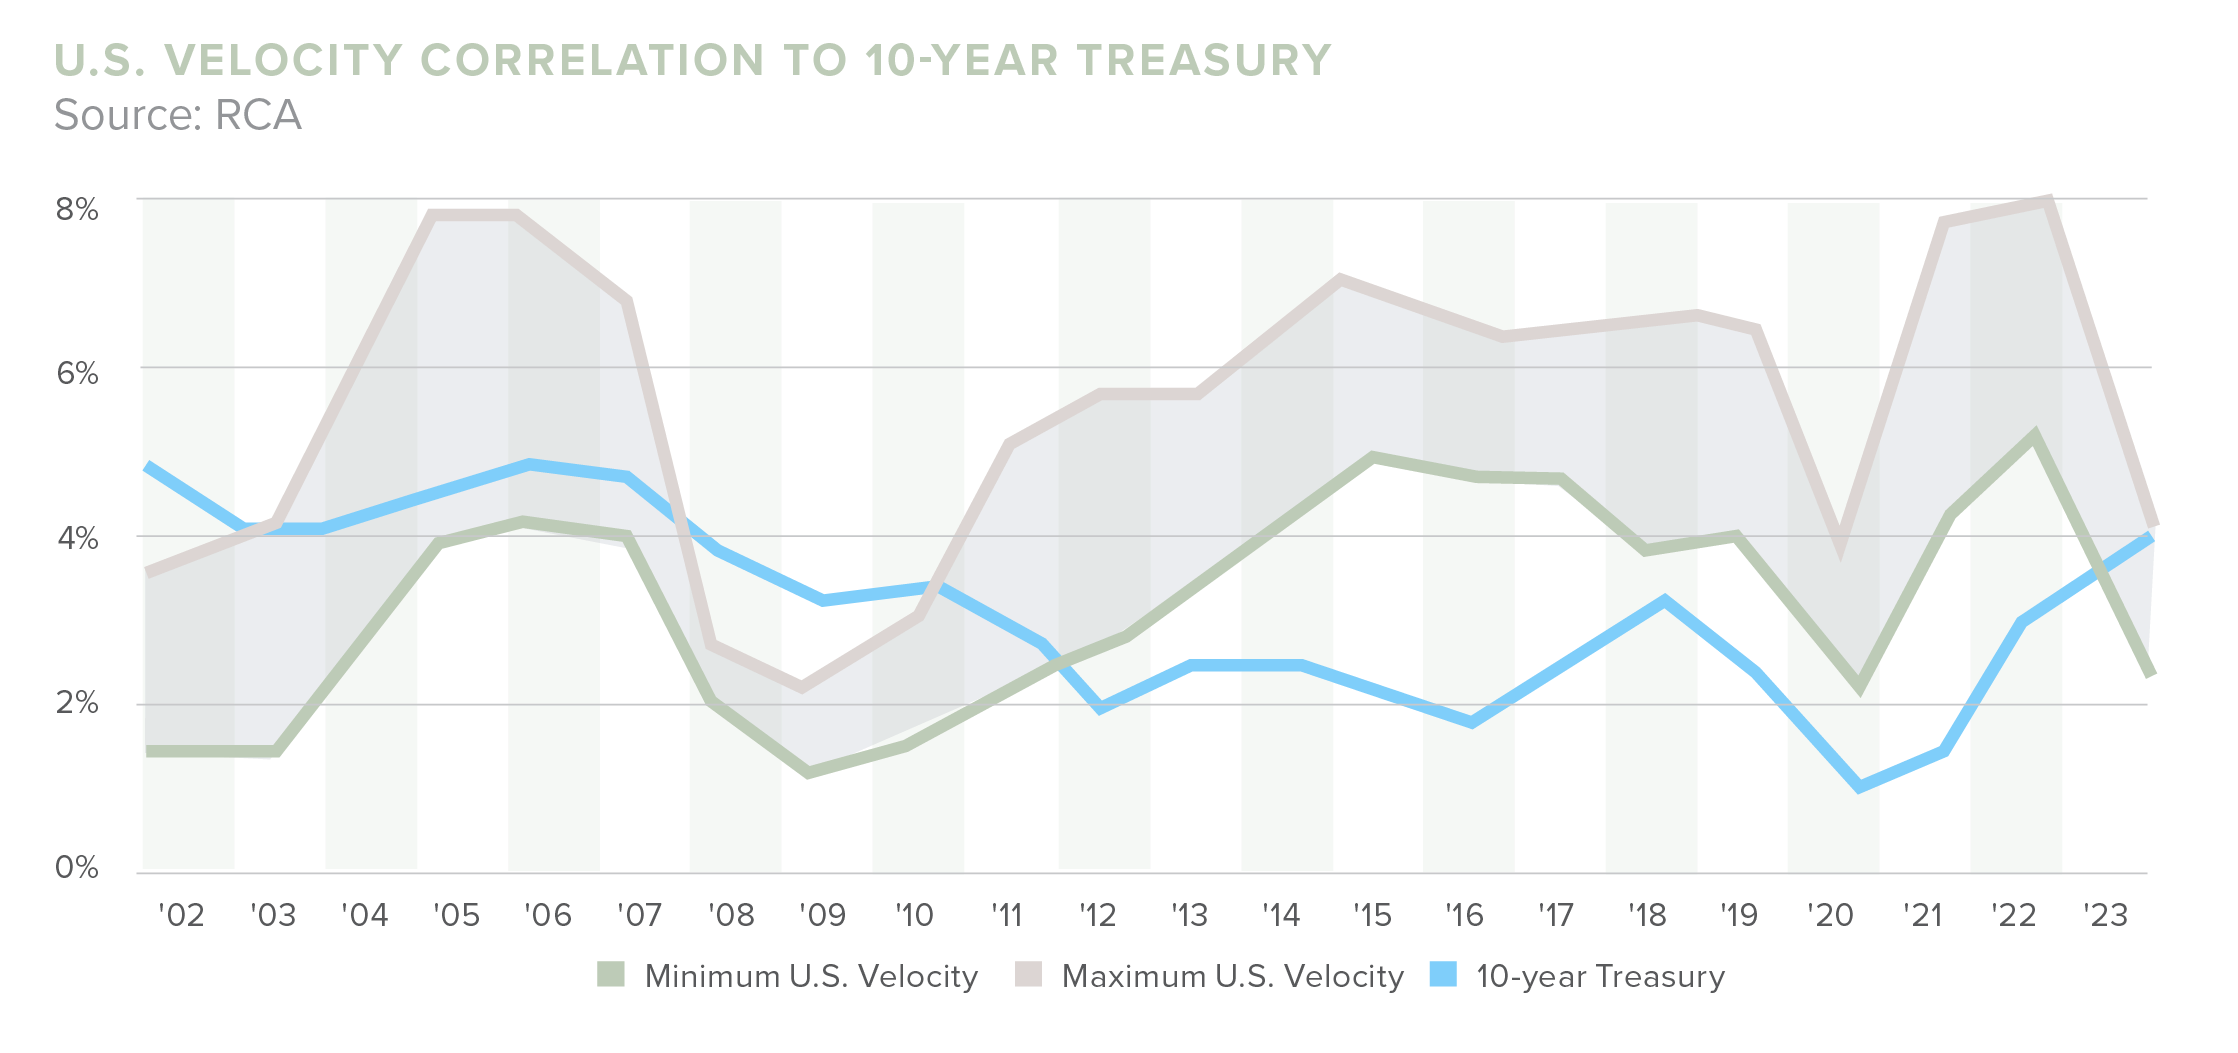
In the ever-evolving landscape of multi-tenant retail, transaction velocity has seen highs and lows over the past 20 years. Despite the fluctuations, the sector has exhibited resilience. It has found solid ground with sustained strength in retail sales, responding positively with investors. This article highlights the intriguing trajectory of multi-tenant velocity by exploring transaction patterns and contextualizing them with economic and industry shifts, unraveling the relationship between multi-tenant transactions and the fluctuations in the 10-year Treasury.
Stock – Existing number of assets in the market
Velocity – Turnover of the stock
The data highlighted includes centers classified as anchored, unanchored, and grocery-anchored over 10K square feet, priced at $2.5 million and above.
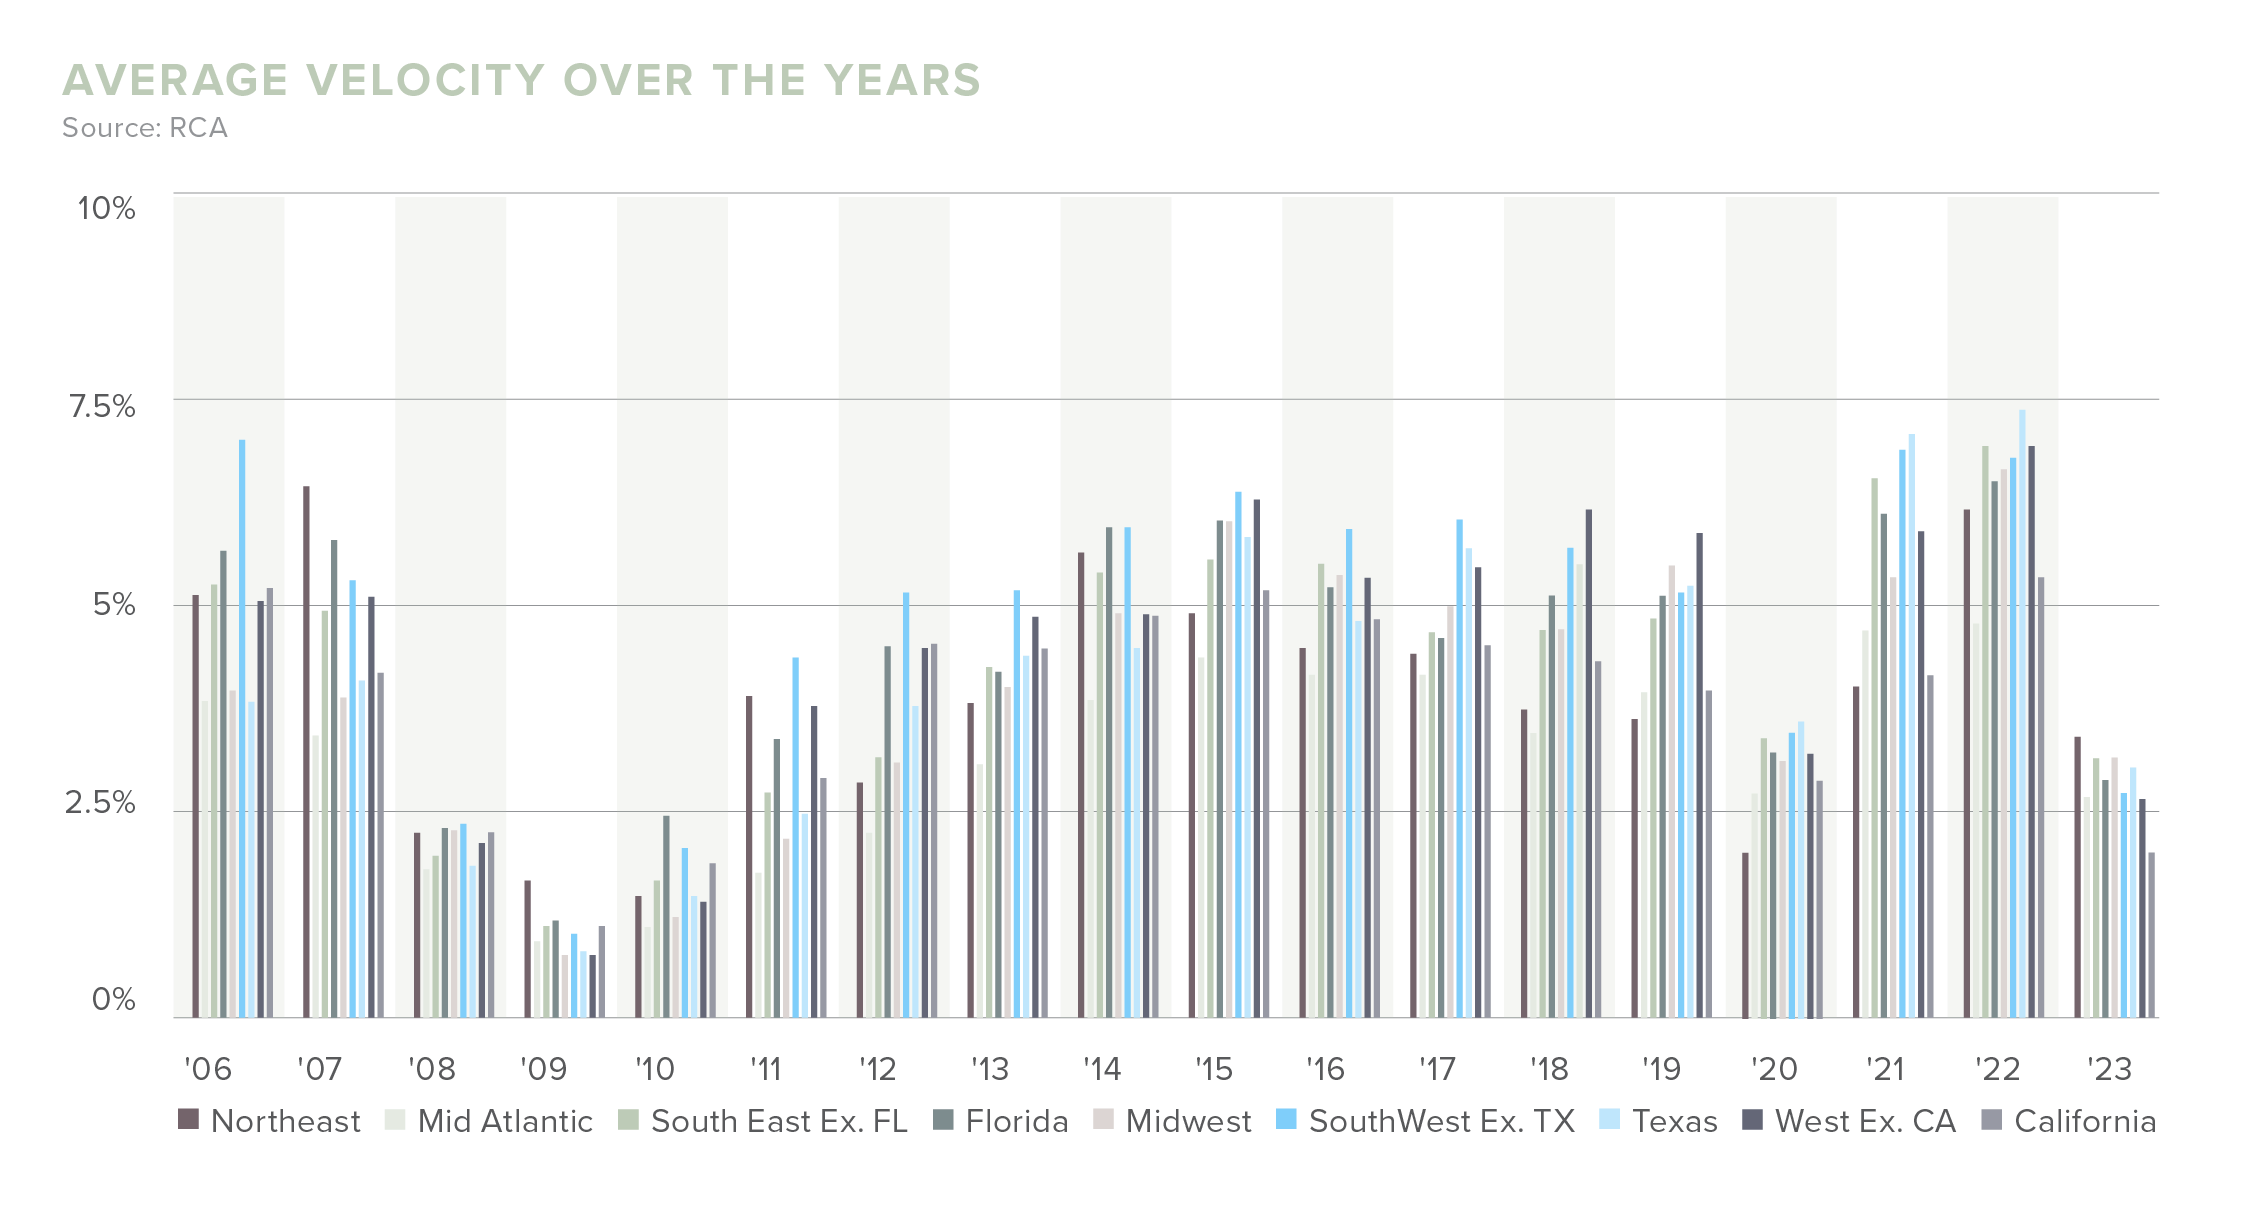
Multi-Tenant Velocity Over the Last 5 Years
Over the past five years, transaction velocity for multi-tenant retail has been on a rollercoaster of a ride, but the reality is year-over-year retail sales have continued to get stronger with the sector finding its footing with investors, tenants, and developers.
2018
2.91% Average Interest Rate | 5.32% Average Multi-Tenant Velocity
In 2018, there were 2,403 transactions with an average price of approximately $9.1 million, averaging $144 per square foot and a cap rate of 7.5%. This year saw the highest sales volume in a single quarter despite the “noise” around the demise of brick-and-mortar retail. It all centered around the concept that underlying economic fundamentals had placed the consumer in a position of strength that they hadn’t seen for some time. Headwinds were minimal – consumer spending hit a six year high, and the savings rate dropped to a 12-year low.
2019
2.14% Average Interest Rate | 5.35% Average Multi-Tenant Velocity
In 2019, transactions were on par with 2018. The average sale price and price per square foot increased to $9.9 million and $158, respectively. Where things get interesting is cap rates went up by a slim margin to 7.7% for an approximate 2% increase. During this time, economic expansion tightened core markets, and secondary or tertiary markets began to gain more investor traction. While consumer confidence and spending remained elevated and property fundamentals were strong, the retail industry began seeing more vacant big-box space, with large retailers shuttering locations and announcing closures. Brands such as Sears, Macy’s, and JCPenney declared bankruptcy.
2020
0.89% Average Interest Rate | 3.18% Average Multi-Tenant Velocity
While the decline in physical retail stores began before the arrival of the pandemic, the pandemic served as the final nail in the coffin for struggling retailers. Chains falling behind on consumer trends and preferences, like online shopping, saw depleting sales during nationwide lockdowns. But it wasn’t all bad news; 2020 was the year when retail was forced to transform and pivot business models to meet modern consumer needs. The multi-tenant retail space changed as the vacancies were filled with more appropriate tenants, and the pandemic or recession resilient anchors (such are grocers) took center stage as the darling asset for investors. While 2020 doesn’t accurately represent the market, here’s what center fundamentals looked like that year – the average sale price was $8.5 million, the sale price per square foot was $143, and the average cap rate was 7.4%.
2021
1.45% Average Interest Rate | 6.22% Average Multi-Tenant Velocity
In 2021, the market correction began, and 2,812 transactions occurred. The average asset price jumped back to pre-pandemic levels at $9.9 million and $156 per square foot, but cap rates decreased to 7.3%. Shopping center owners began to implement and upgrade centers to accommodate curbside pickup centers, and more centers began to see a healthier tenant mix that complemented instead of competed.
2022
2.95% Average Interest Rate | 7.12% Average Multi-Tenant Velocity
Compared to the last 10 years, 2022 saw record-breaking transactions, and a large portion of the nation’s multi-tenant retail exchanged hands. Approximately 3,216 total sales were recorded, the average sale price increased to $10.4 million, the sale price per square foot jumped to $169, and cap rates declined to 6.9%.
2023
3.86% Average Interest Rate | 3.15% Average Multi-Tenant Velocity
As of October 2023, commercial real estate transaction volume across all sectors was down 68% to $19.3 billion. While still negative compared to a year ago, retail saw more favorable transaction velocity in 2023. Transaction velocity was down 48% with $2.9 billion in transaction volume. At the heart of the problem is the dramatic rate increases by the Fed that began in Spring 2022, and despite the two pauses in September and November of 2023, there’s no guarantee that the hoped-for decreases will materialize in 2024.
This has made returns to investors more challenging and debt more expensive, further compounding the problem, widening the bid-ask spread, and elevating valuations of assets. With debt leverage down and interest rates up, achieving accretive returns is challenging, pushing investors to the sidelines and transaction velocity down. Approximately only 1,422 transactions have taken place, the average sale price declined to $9.1 million, the sale price per square foot declined to $154, and cap rates jumped to 7.3%.
So, what does all that mean, and why are we looking at the past? These numbers show that sales are still robust for the asset class despite the challenging economic environment. There remains and will always remain a steadfast level of interest in this type of investment.
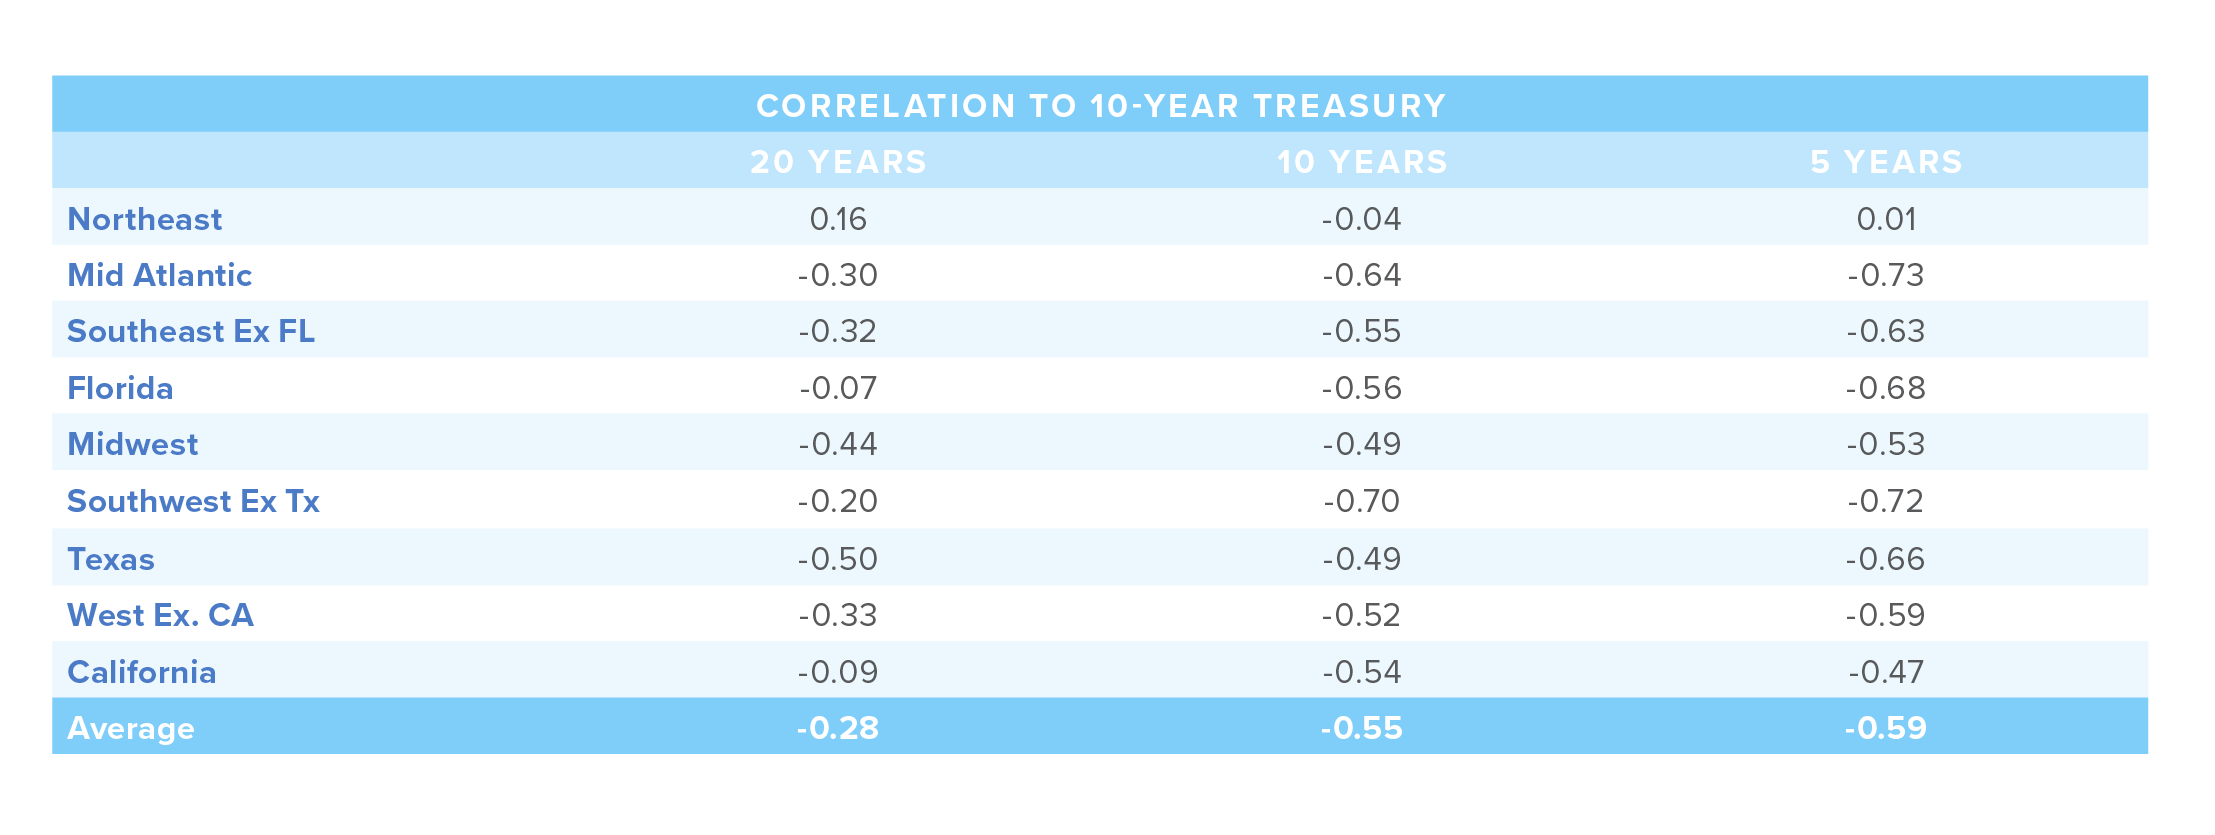
This table shows the correlation coefficients between the velocity of different regions over 20, 10, and five years. The positive values indicate a positive correlation between the region’s velocity and the 10-year Treasury. In simple terms, as the 10-year Treasury increases, velocity increases as well. Conversely, negative values indicate an inverse relationship. In the Northeast, a positive correlation between the region’s velocity and the 10-year Treasury is strongest over the past 20 years.
Multi-Tenant Velocity: Northeast
The Northeast stands out as a unique real estate market for several reasons. First, there’s a notable “flight to safety” phenomenon, where investors perceive the region as secure. This perception is bolstered by a combination of factors, including high barriers to entry, limited development, and constrained supply. The stability in rents further enhances the attractiveness of the Northeast as an investment destination.
The region’s resilience during economic downturns is attributed to its density and wealth, providing insulation against recessionary pressures. Notably, the historical ownership pattern reveals that assets in the Northeast are often generationally owned. Although, a recent trend shows these assets increasingly being traded to REITs. This shift contributes to a decrease in transaction frequency as institutions tend to hold onto assets for extended periods. There is a growing trend of generational owners collaborating with institutions, adding a layer of complexity to market dynamics. Despite this, the market remains fragmented, with a significant portion of properties owned by high-net-worth individuals.
Joint venture partnerships, partial interest sales, and UPREITs provide alternative options for owners today to explore.