The Assets That Remained Liquid

Shopping centers experienced mixed results from the challenges presented throughout 2020. Depending on their anchor and location, shopping centers either struggled or flourished. Quality, well-positioned assets with essential retailers witnessed heightened demand, while shopping centers with predominantly discretionary stores saw depleted revenue and decreased demand from investors and consumers. In this article, Matthews™ will discuss the performance metrics of various shopping center subtypes.
Defining the Various Shopping Centers
The vast majority of shopping centers fall into one of the following categories: strip centers, neighborhood centers, community centers, power centers, and regional malls. The main differentiators between the various classifications are size, location, and use. Each subtype is defined below.
Strip Centers
Typically features a row of stores or service outlets with on-site parking located in front of stores
- Average Square Feet: <30,000
- Typical Anchors: Convenience store, restaurant, service-oriented store
Neighborhood Centers
Similar to community centers but on a smaller scale and sells general merchandise or convenience-oriented offerings
- Average Square Feet: 30,000 – 125,000
- Typical Anchors: Discount store, supermarket, drugstore, convenience store
Community Centers
A straight line of retailers in an L or U shape that sell a wider range of apparel and soft goods
- Average Square Feet: 125,000 – 400,000
- Typical Anchors: Discount store, supermarket, drugstore, large-specialty discount store
Power Centers
Anchored by big-box tenants accompanied by smaller tenants
- Average Square Feet: 250,000 – 600,000
- Typical Anchors: Big-box retailers, such as home improvement, discount department, warehouse club, and off-price stores
Regional Malls
An enclosed shopping center with general merchandise and fashion-oriented offerings, surrounded by parking outside the perimeter
- Average Square Feet: 400,000 – 800,000+
- Typical Anchors: Full-line or junior department store, mass merchant, discount department store, and/or fashion apparel store
Comparing Performance
Strip Centers
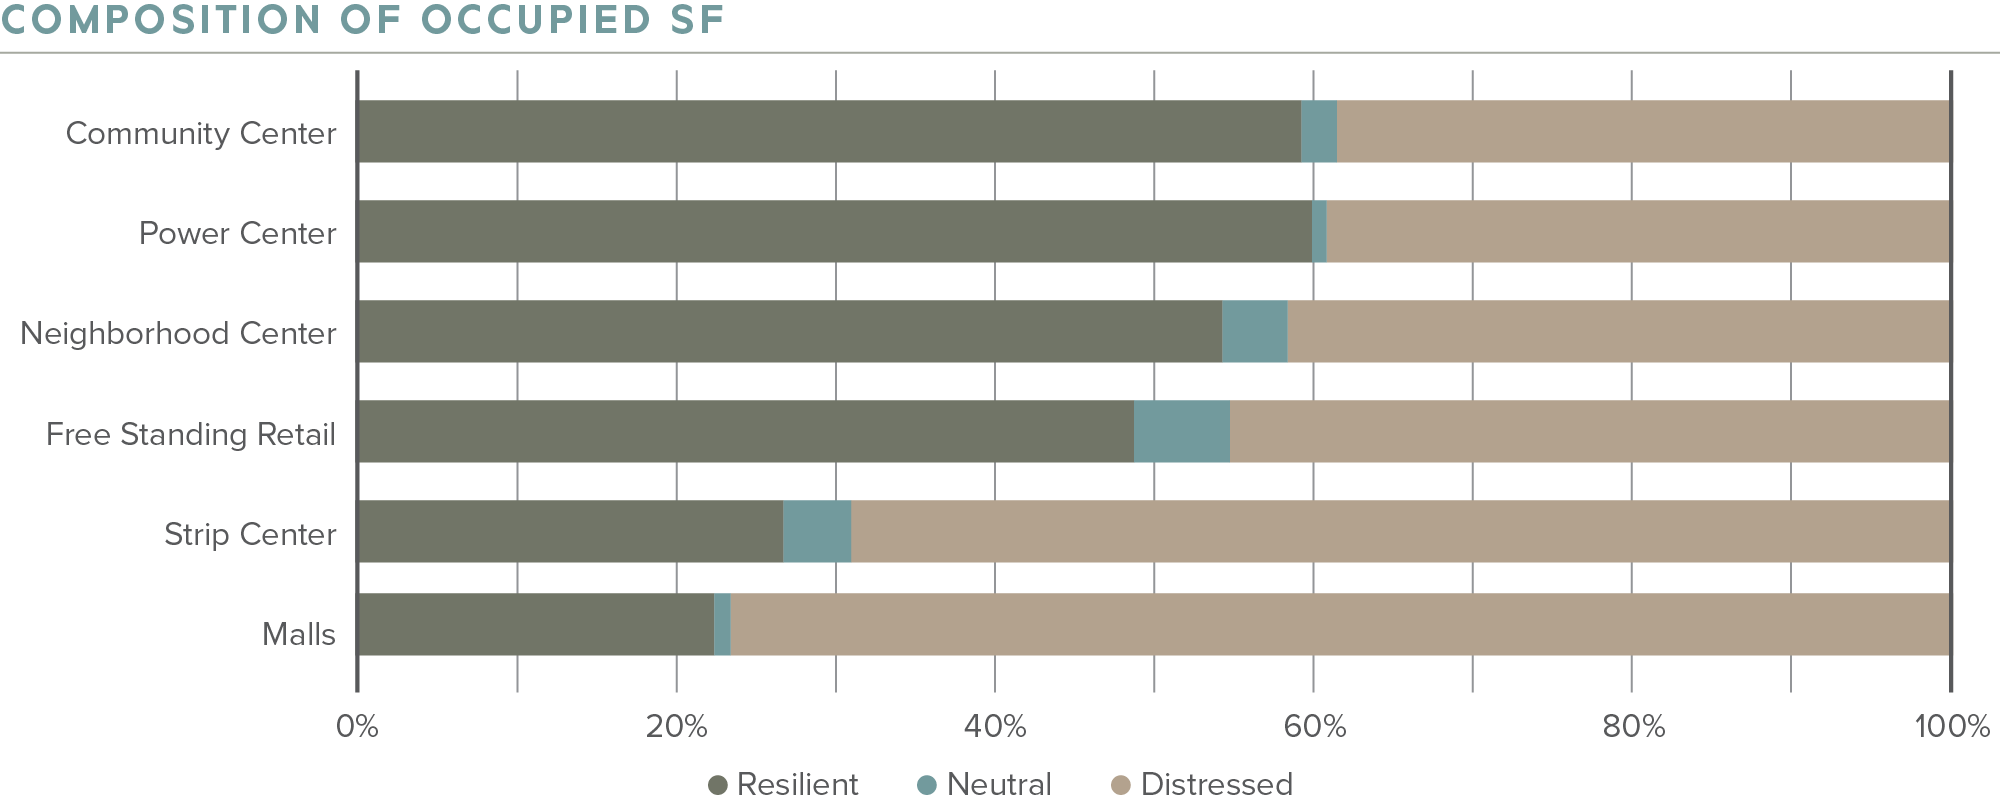
Strip centers have continued to be a strong performer for shopping center investors as e-commerce and the demand for smaller retail footprints place pressure on larger shopping centers. According to CoStar, availability in the strip center sector has steadily declined over the last three years. There is significantly more demand for 3,000 square foot spaces in today’s market than 30,000 square foot spaces, which has proven to be a very favorable shift for strip center investors in recent years. Due to the decreased tenant liability associated with a smaller retail footprint, tenant demand for smaller retail suites, most often located in strip centers, has quickly grown to exceed supply. Although strip centers felt the effects of COVID-19, with non-essential retail accounting for 58 percent of the segment, strip centers are outperforming their REIT counterparts and the overall commercial real estate market, according to BTIG Research. Following the vaccine news in September, investors have continued to focus on strip centers around the country. Further, the vigorous leasing activity beginning in the latter half of 2020 will benefit strip centers throughout 2021.
With the growing trend of large tenants such as Barnes & Noble looking to downsize, leasing demand has shifted from the once-popular big-box space to smaller suites found in strip centers. In markets where big-box retailers have historically thrived, the map is now dotted with vacancies and subdivided space resulting from previous tenants shrinking their brick-and-mortar footprint. Accordingly, shopping center investors have become increasingly aware of the risks associated with leasing space to larger tenants whose foot traffic may be heavily impacted by the rise of e-commerce.

Neighborhood Centers
Neighborhood centers felt the least exposed during COVID-19, optimizing Buy Online Pick-Up In-Store
(BOPIS) tactics and curbside pick-up. Over 50 percent of these shopping centers are grocery-anchored and command premium rents, especially after grocers’ strong performance last year. Other common tenants include drugstores, home improvement stores, and other service-oriented stores. For the most part, these tenants maintained healthy rent payments. For example, home improvement stores averaged 97 percent in rent collections throughout the pandemic, resulting in investor demand for the product type.
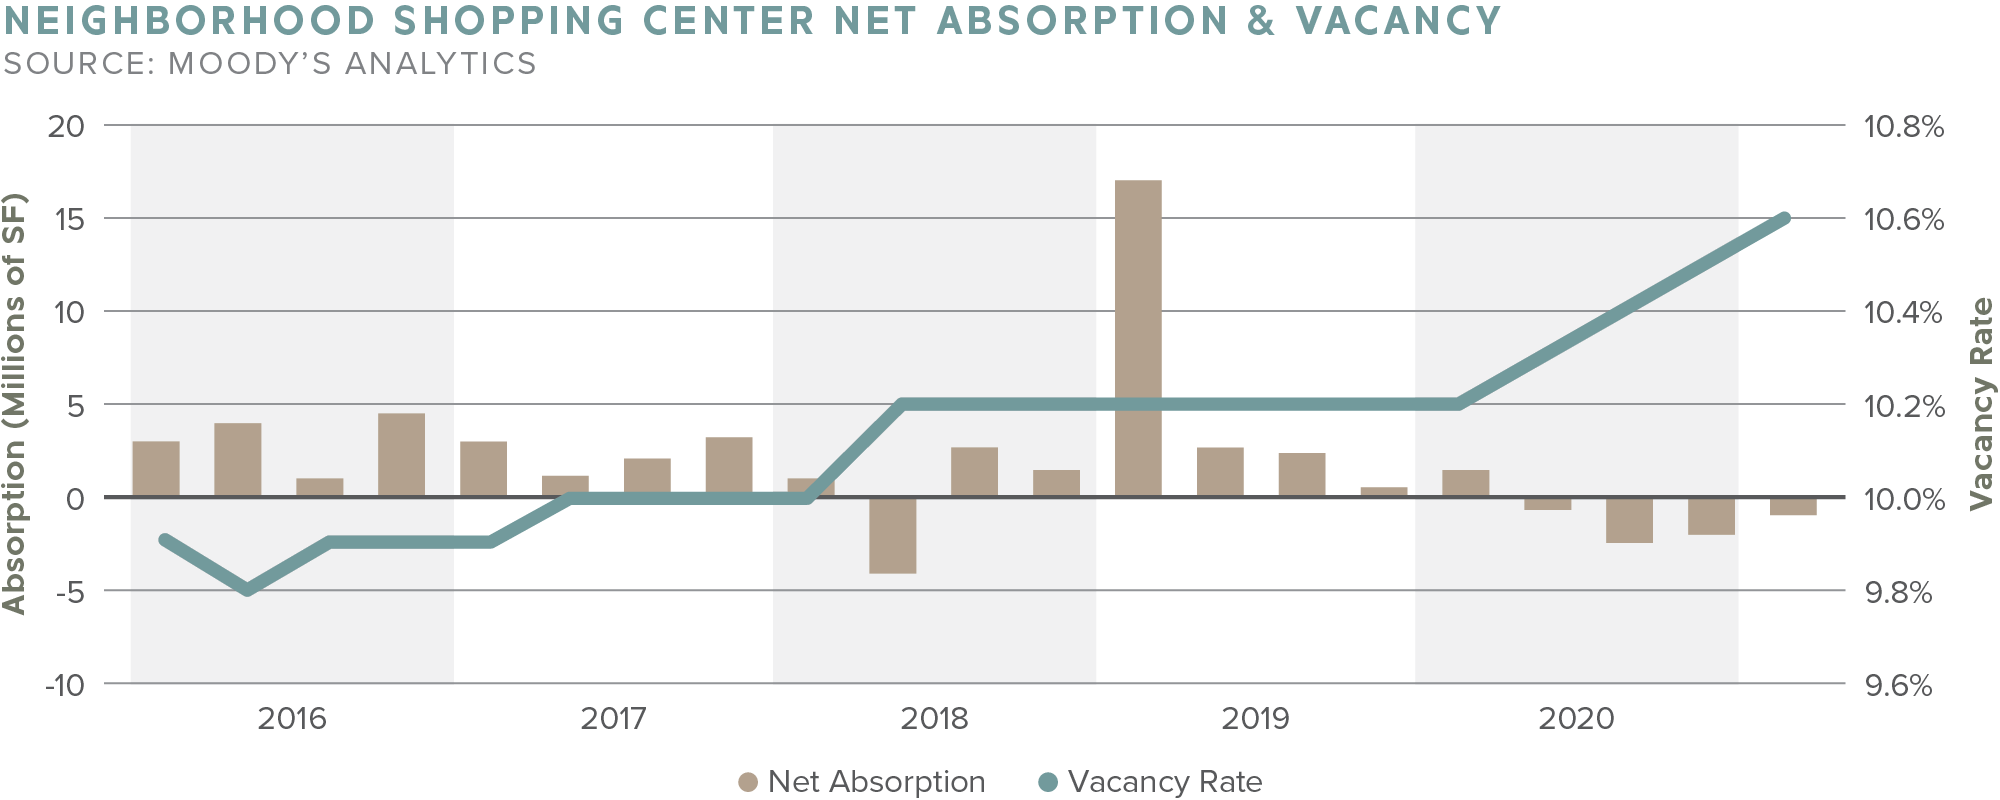
According to Moody’s Analytics, a record low 144,000 square feet of neighborhood shopping center space was added in Q1 2021, compared to 944,000 square feet added in Q4 2020. Both are below the 2018 and 2019 quarterly average, 2.5 million square feet and 1.76 million square feet, respectively. This resulted in vacancies rising 10.6 percent and asking rents decreasing 0.1 percent. On a national level, 33 of 80 metros monitored by Moody’s saw positive absorption, a positive trend compared to Q3 and Q4 2020.
Community Centers
Drawing in a customer base within three to six miles, community shopping centers offer a wide range of retail stores and sometimes feature two anchor stores. Due to their open-air format and category-dominant anchors, including Walmart, Target, and Kmart, community centers remained afloat. Discount retailers are also commonly found as anchors to community centers and have maintained relatively consistent foot traffic and revenue throughout the pandemic.
Power Centers
If an essential tenant anchors a power center, it is viewed as a stable asset. The quality of the tenant played a vital role in power centers’ performance last year. Big-box chains that often occupy these centers have the resources and robust supply chain to compete with e-commerce as many have an existing online presence. However, the local retailers accompanying the big-box tenants do not have the same resources and suffered from lost revenue. Due to the struggling small retailers, investors should look for supporting tenants and consider alternative businesses from apparel, such as healthcare clinics, service-oriented stores, or discount chains. These essential tenants remained open during the pandemic and can benefit the center with consistent foot traffic and revenue.
Regional Malls
It’s no secret that America’s traditional shopping malls suffered in the wake of COVID-19. Almost the entirety of mall occupants, about 90 percent, are experiential, like movie theatres, or apparel stores, according to Coresight. Despite malls only accounting for ten percent of total retail space, they made up for 60 percent of store closures in 2020. Contributing to this is the lack of tenant diversity, with the roster primarily encompassing discretionary retail. With prominent tenants such as JCPenney, Neiman Marcus, J. Crew, Lord & Taylor, and Brooks Brothers all filing for bankruptcy protection in the past year, the demise of many department stores, which historically contributed to mall foot traffic, also played a role in the mall sector’s decline in 2020.

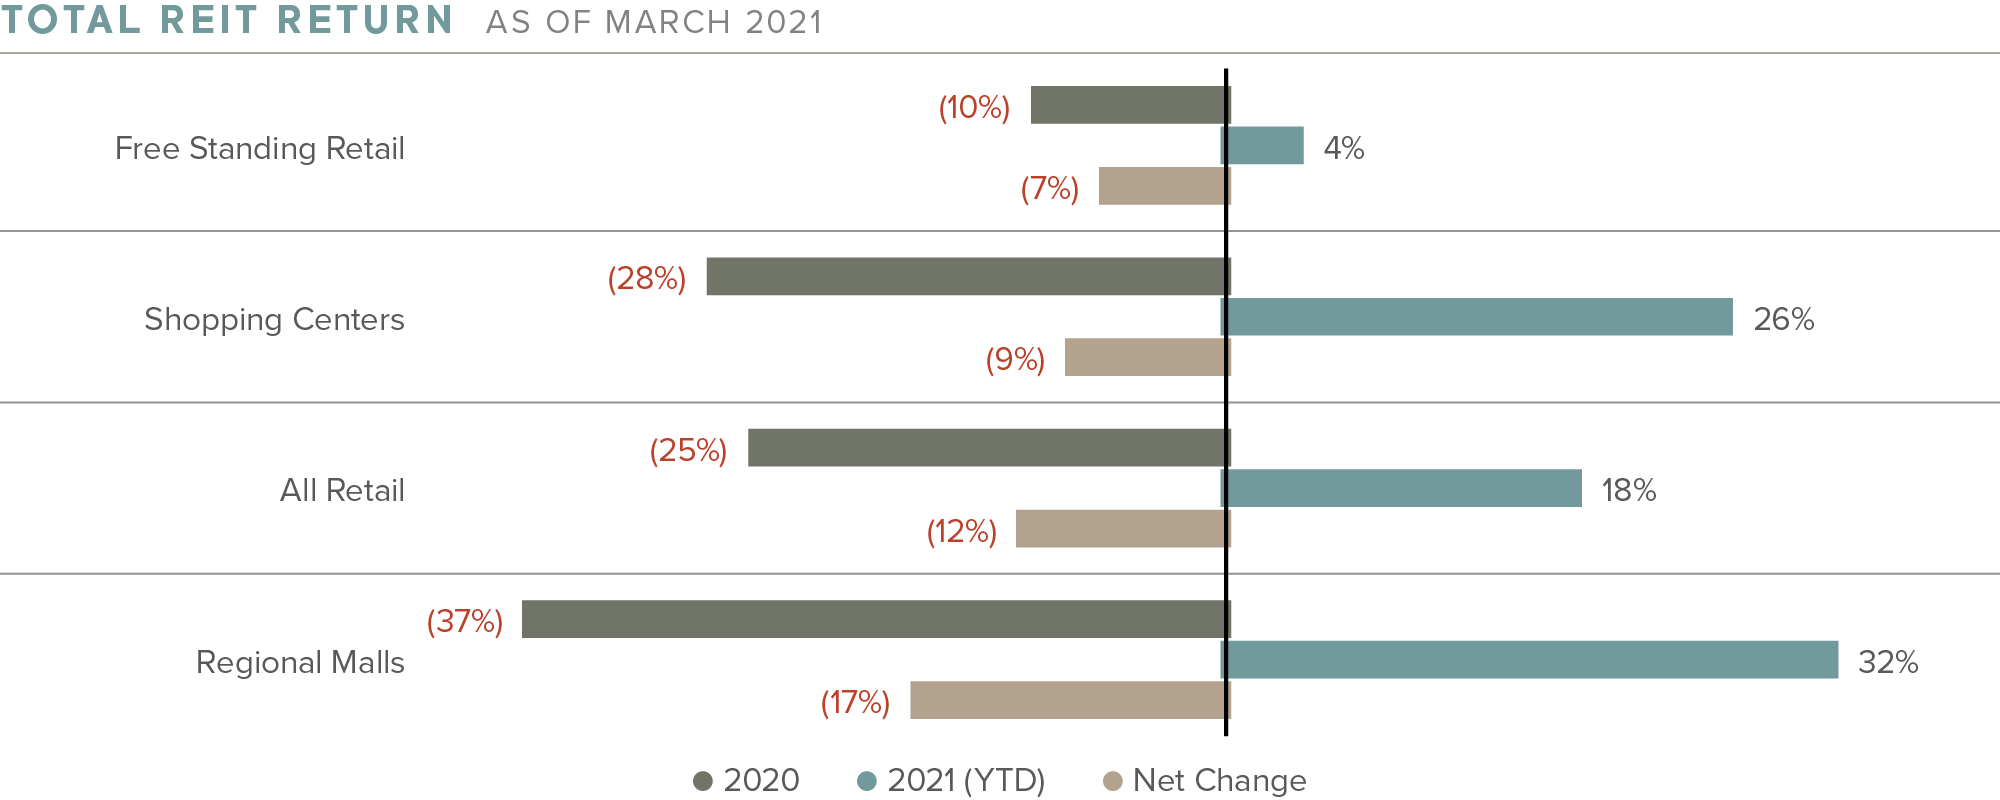
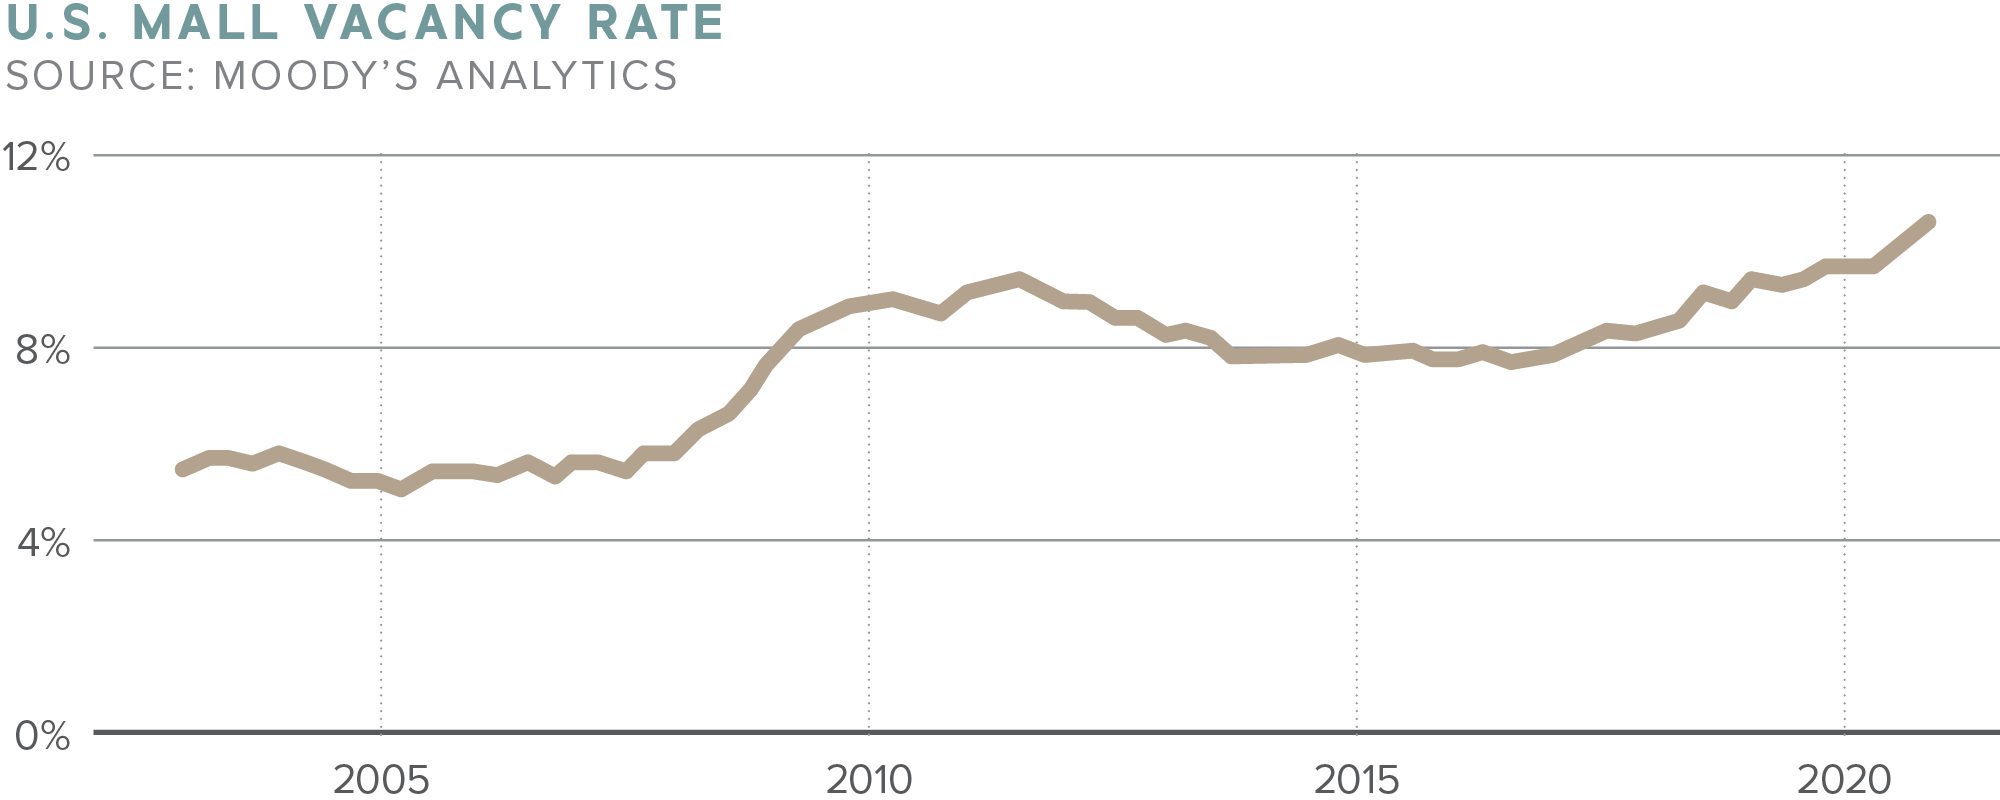
Average vacancies increased in malls by 90 basis points in Q1 2021, to a new record of 11.4 percent. The average rent declined 0.2 percent, but this is an improvement from 2020’s quarterly 0.8 percent decline. Moreover, CoStar reports that malls have made significant strides so far in 2021, as total returns climb by 32 percent as of Q2, exceeding other retail subtypes. The most at-risk malls are classified as B, C, or D rated malls (each bringing in fewer sales per square foot than A-rated malls). Roughly 380 U.S. malls are C or D rated, according to Green Street Advisors.
The Best Performing Region
Primary markets have always been the pinnacle of capital and investor focus, but that focus has shifted as investors hunt for better deals, less competition, and higher yields in smaller markets. In 2019, 60 percent of commercial real estate transactions over $1 million were in non-primary markets. Investors previously targeting the West and East Coasts have turned their attention to the Southeast due to fewer regulations and lower taxes in the region. Although the migration of capital into the Southeast has been an ongoing process over the past two decades, the National Association of Realtors predicts the Southeastern markets to grow at unprecedented rates in 2021. The affordability of these markets has attracted population growth and corporate migration, drawing in investor demand.
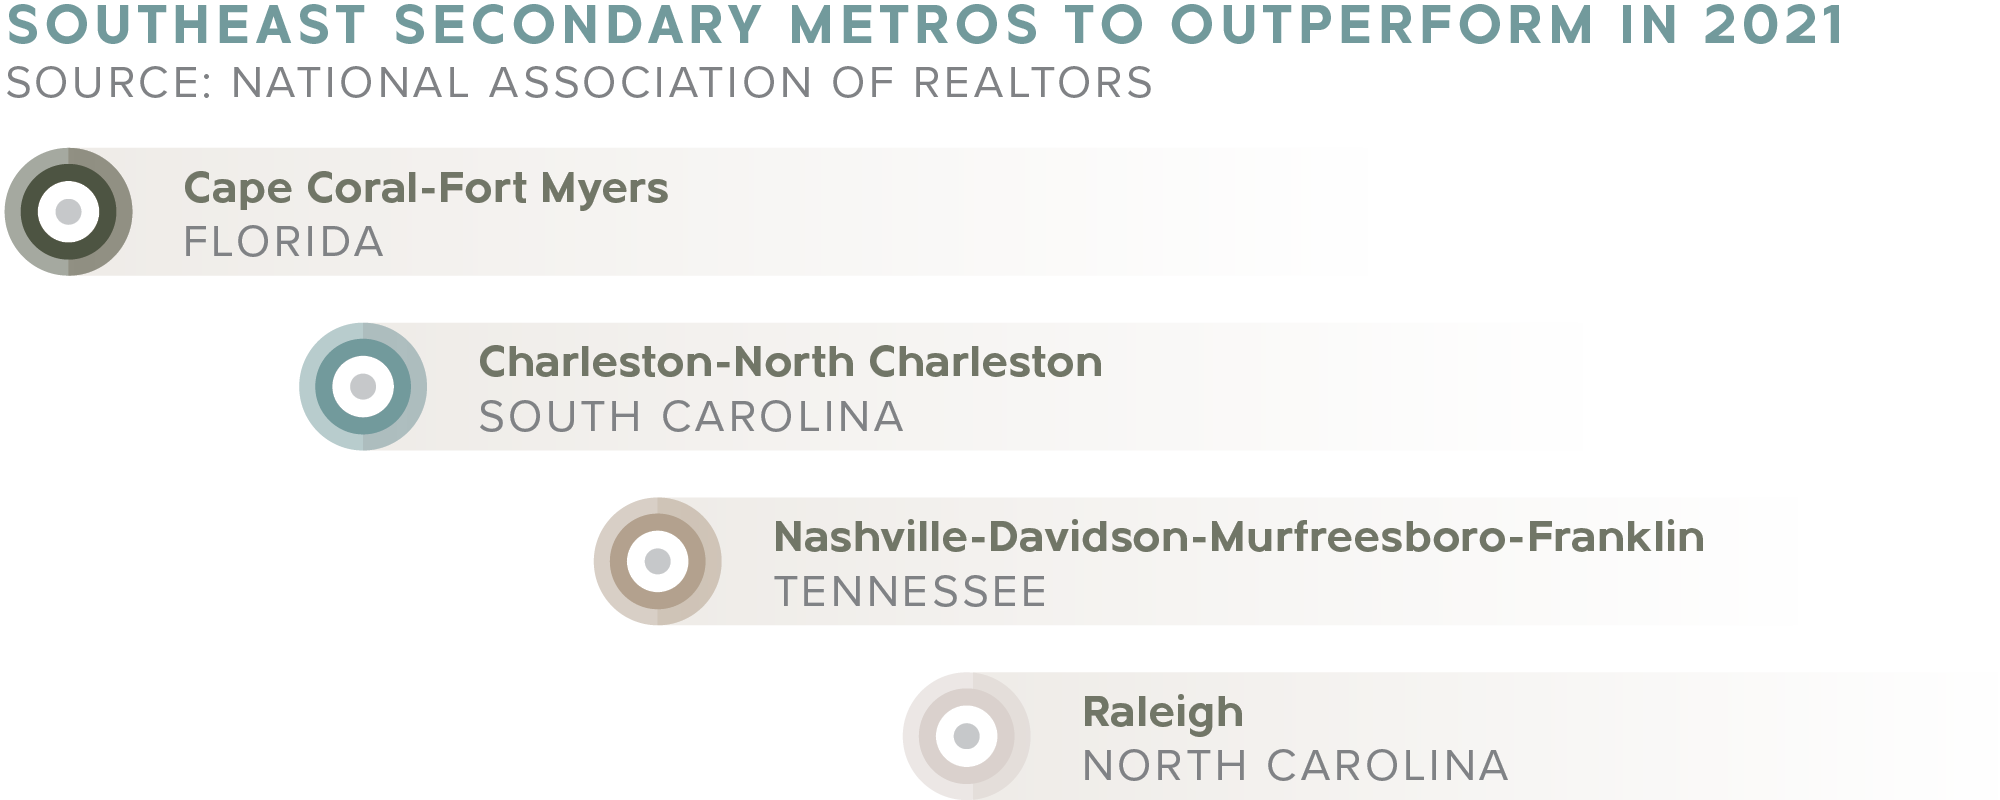
The Southeast has benefited from the pandemic-induced mass migration from dense metro hubs to affordable, less populated secondary gateway markets. Since 2014, net population migration to secondary and tertiary markets has been 200 percent higher than that of dense metros. As companies and people continue to move to the region, the number of single-family homes and neighborhoods will grow, and so will the commercial real estate opportunities. Accordingly, many large REITs have shifted their focus to the Southeast, specifically targeting shopping centers with essential retail such as grocery-anchored community centers and power centers with value-add opportunities.
Interestingly, regional malls throughout the Southeast saw the most year-over-year transactions compared to other shopping center assets, a 30 percent increase in 2020. This could be attributed to opportunistic investors capitalizing on the deeply discounted prices of abandoned malls. Outlet malls closely follow, with a zero percent change, and strip centers with a year-over-year decrease of 6.09 percent in 2020.
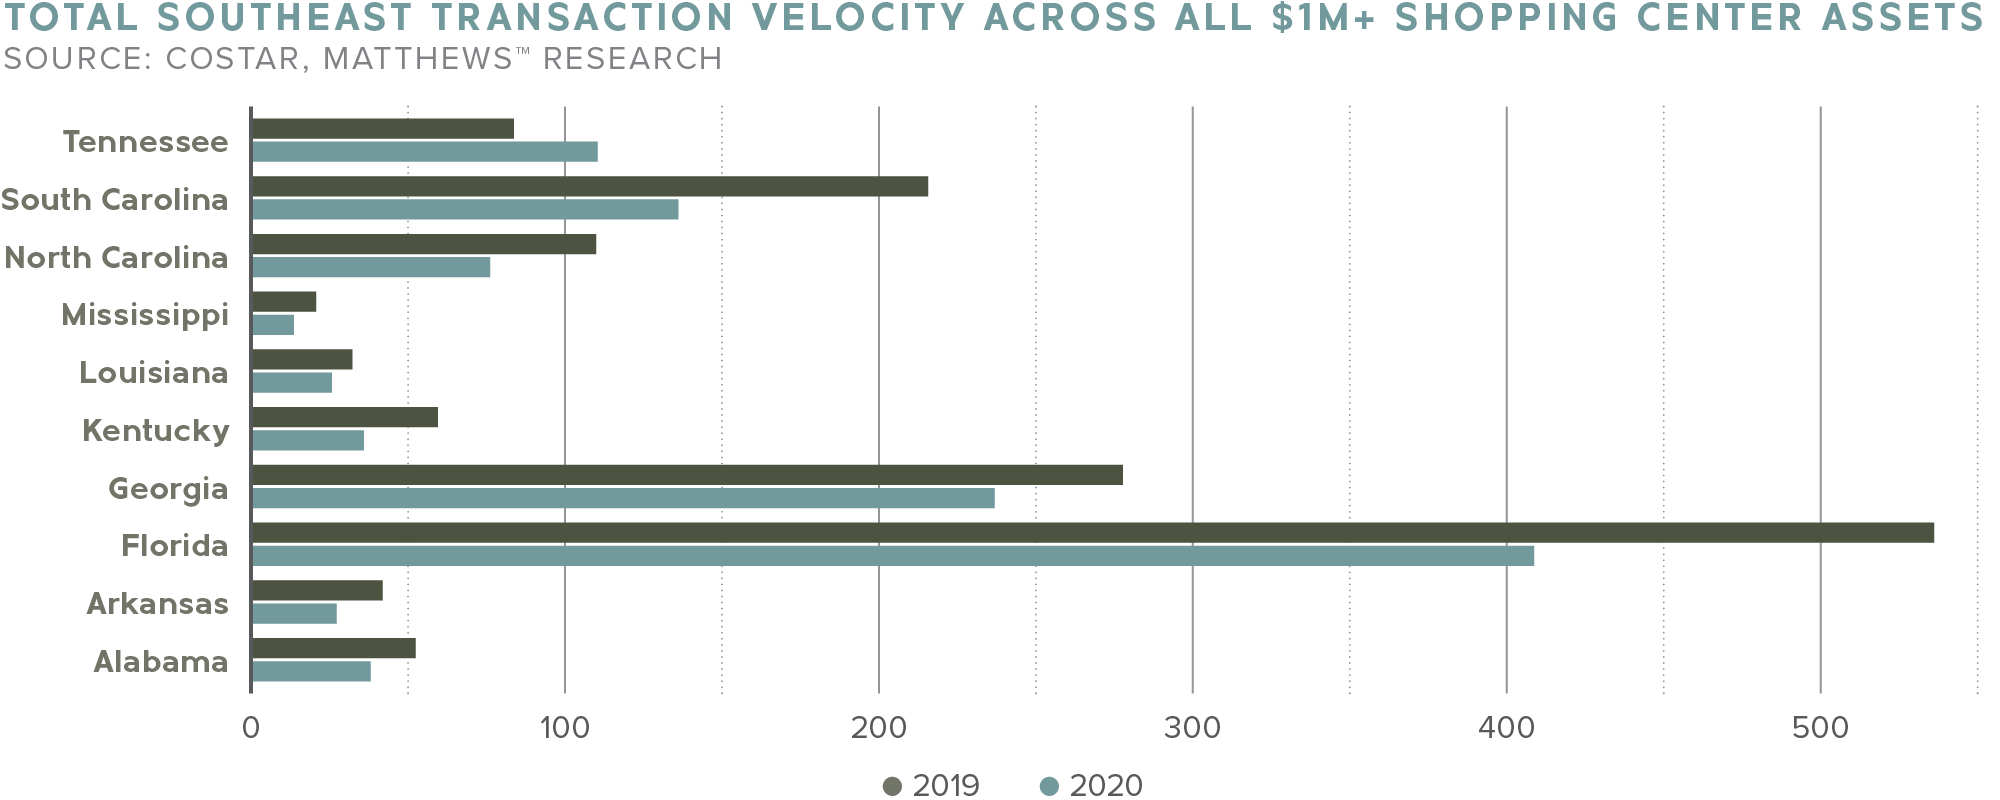
As detailed in the graph below, Tennessee outpaced other Southeastern markets in terms of year-over-year transaction velocity with 111 total shopping center transactions in 2020, a 34 percent increase over 2019. The massive migration of capital into the Tennessee markets can largely be attributed to the state’s business-friendly environment and attractive return profile.
The Financing Environment
Retail, among other sectors, was one of the hardest-hit segments when the pandemic initially hit in March 2020. The mandated closures, market uncertainty, and evolving shopping habits have caused distress on nearly every shopping center subtype. Over 1,000 U.S. shopping center properties are attempting to pay back debt while simultaneously combatting the threat of economic challenges and e-commerce, according to CoStar. Commercial banks hold nearly 38 percent of commercial mortgages, totaling $1.5 trillion.
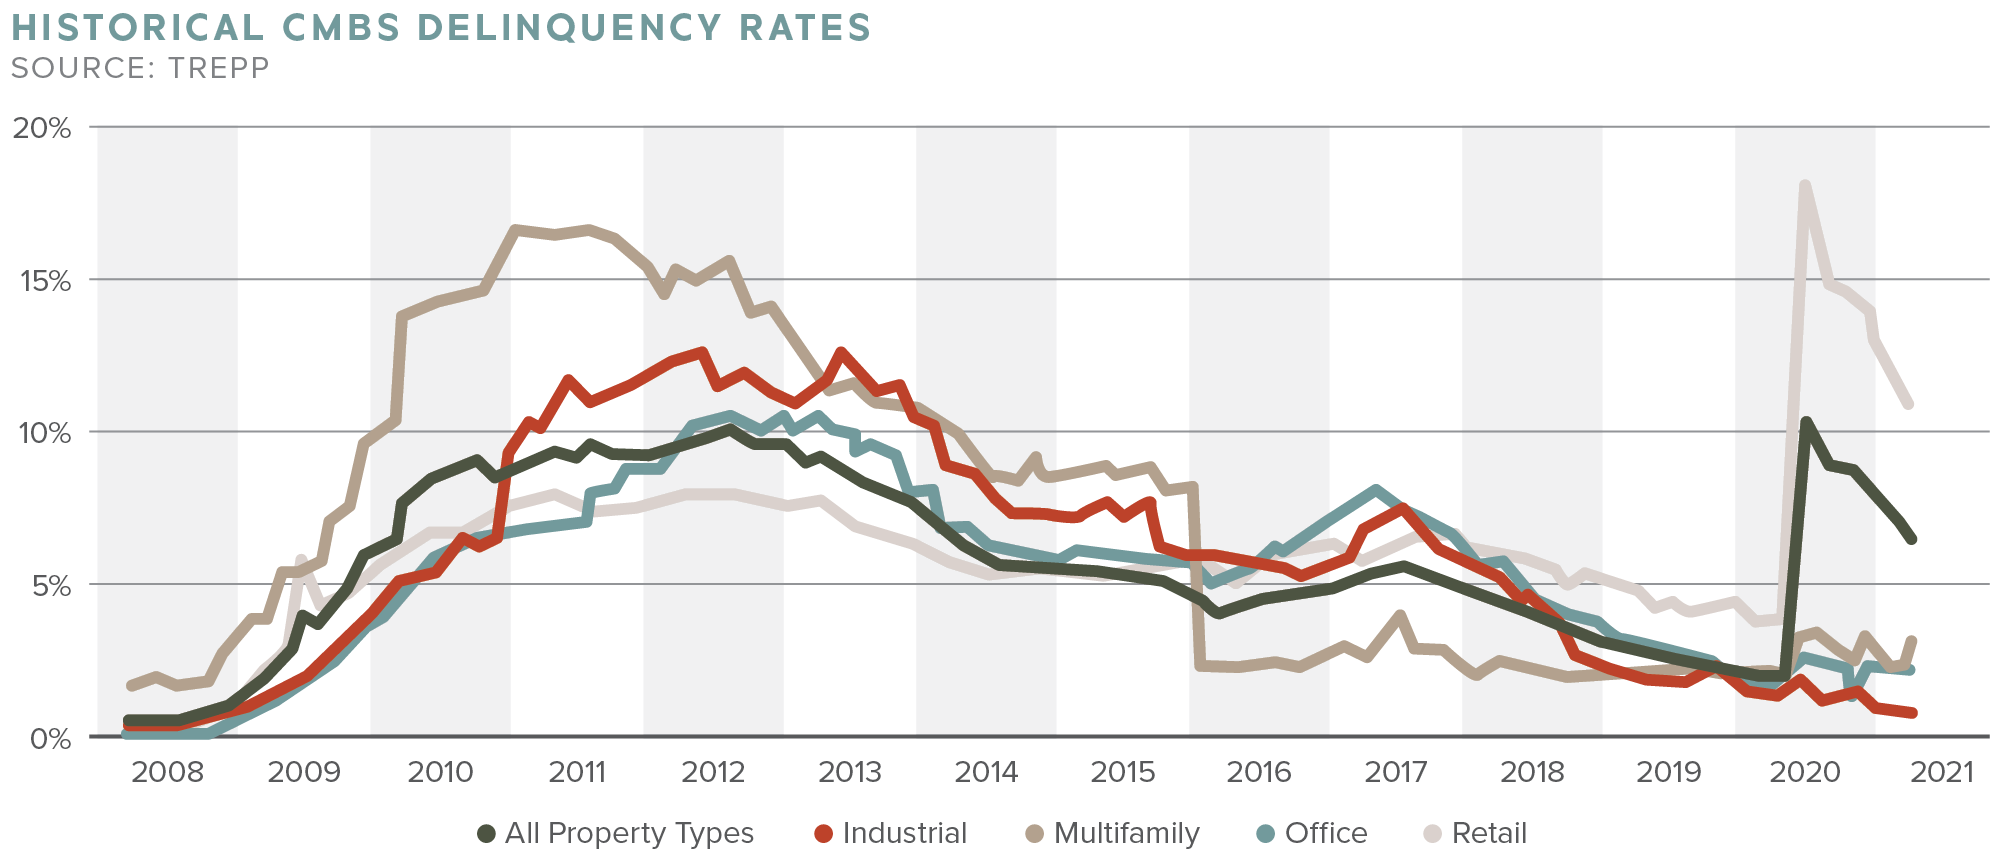
Shopping centers suffered from a lack of available financing before the pandemic as well. Already weakening consumer foot traffic in many retail centers resulted in a 5.36 percent special servicing rate on CMBS loans in November of 2019. The constraints brought on by COVID-19 further depleted retail store sales, causing lenders to restrict financing and increase recourse requirements on smaller shopping centers. For retail assets historically financed with CMBS loans such as malls and power centers with non-essential retailers, the debt market has been nearly non-existent over the past year. As a result, transaction velocity in 2020 was heavily impacted across the sector, with many sellers being forced to hold their larger centers due to the lack of financing available to the buyer pool.
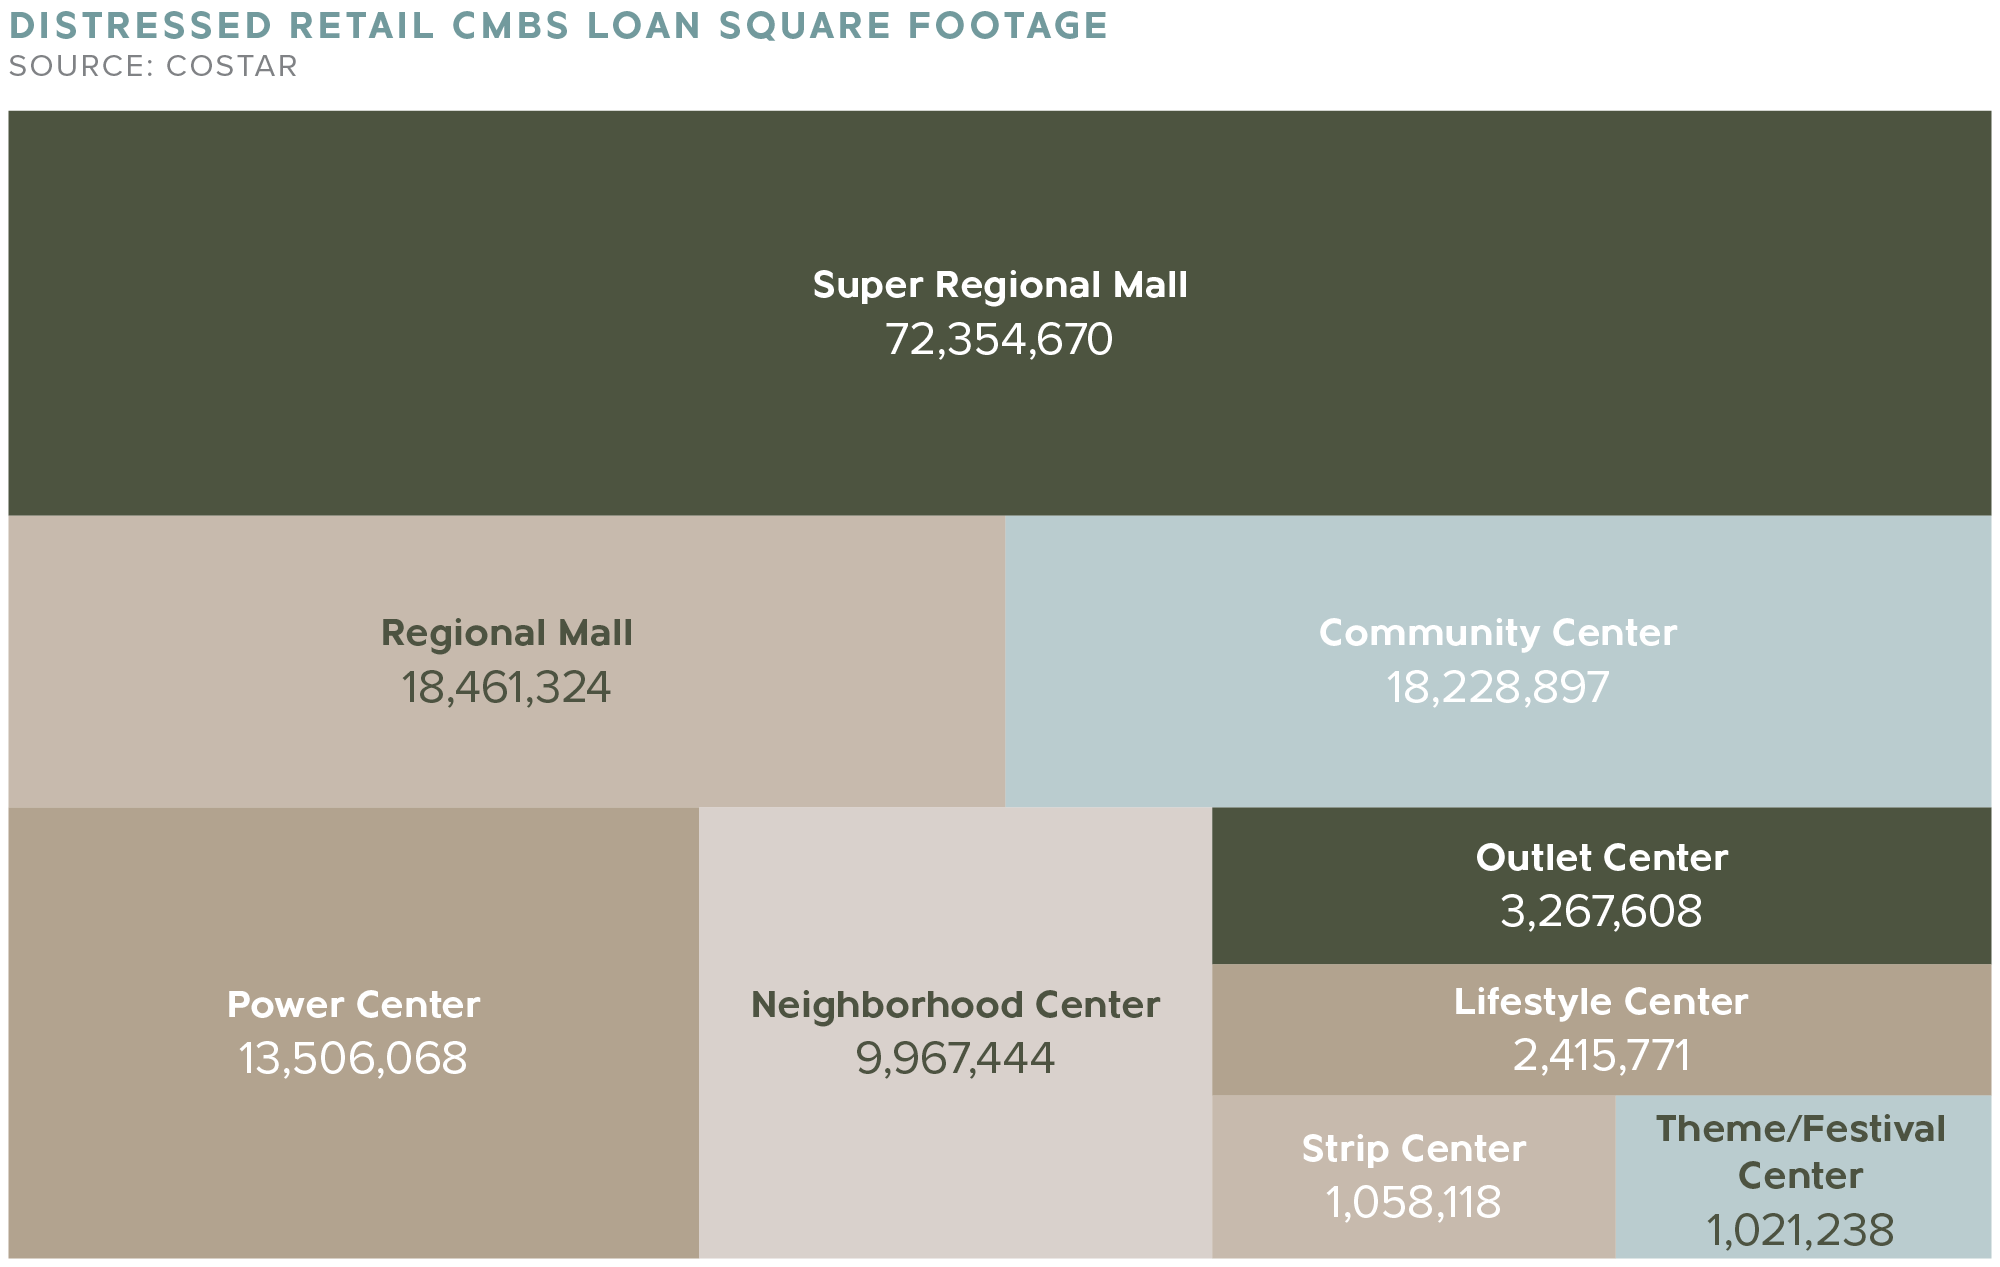
Less than 6.5 percent of total neighborhood and strip center square footage is financed by CMBS debt. Due to their diversified tenant mixes, including quick-service restaurants, grocery stores, drugstores, or personal services, these shopping centers have been able to pay down debt more consistently than their larger counterparts over the past year. A variety of financial institutions continued to lend on neighborhood and strip centers throughout 2020 thanks to their often essential and service-oriented tenant mixes, contributing to a lessened impact on transaction velocity. Smaller footprints, lesser price points, and often lessened risk of significant tenant rollover also contributed to the continued financing of neighborhood and strip centers during the pandemic.
Shopping Center Outlook
2020 proved to be an eye-opening year for shopping center investors throughout the country. With the pandemic restricting retail foot traffic and placing pressure on already weakening tenants, many landlords have been forced to reevaluate the strengths and weaknesses of their portfolios. When looking at which assets continued to trade through the pandemic, essential retailers and service-oriented tenants proved to be a common selling point. Moving forward, it is expected that investor demand will favor assets consisting of tenants who have proven to be resilient during an economic downturn.
The pandemic only accelerated the consumer shift to e-commerce and forced landlords and tenants
to adapt or be left behind. Already, retail demand is shifting to centers with a smaller footprint, such as strip centers, relative to larger community centers. Compared to shopping centers with larger big-box suites, strip centers offer more security for investors due to the relative ease with which smaller stores can be leased and released if a tenant fails.
That being said, there is still hope for the larger retail centers prevalent throughout the country. Many investors have subdivided larger spaces or entirely repurposed vacant big-box space to other uses, such as trampoline parks and self-storage. In all, retail is not dying; the asset class is simply evolving as the market climate shifts due to external factors, like the pandemic and the growth of e-commerce.
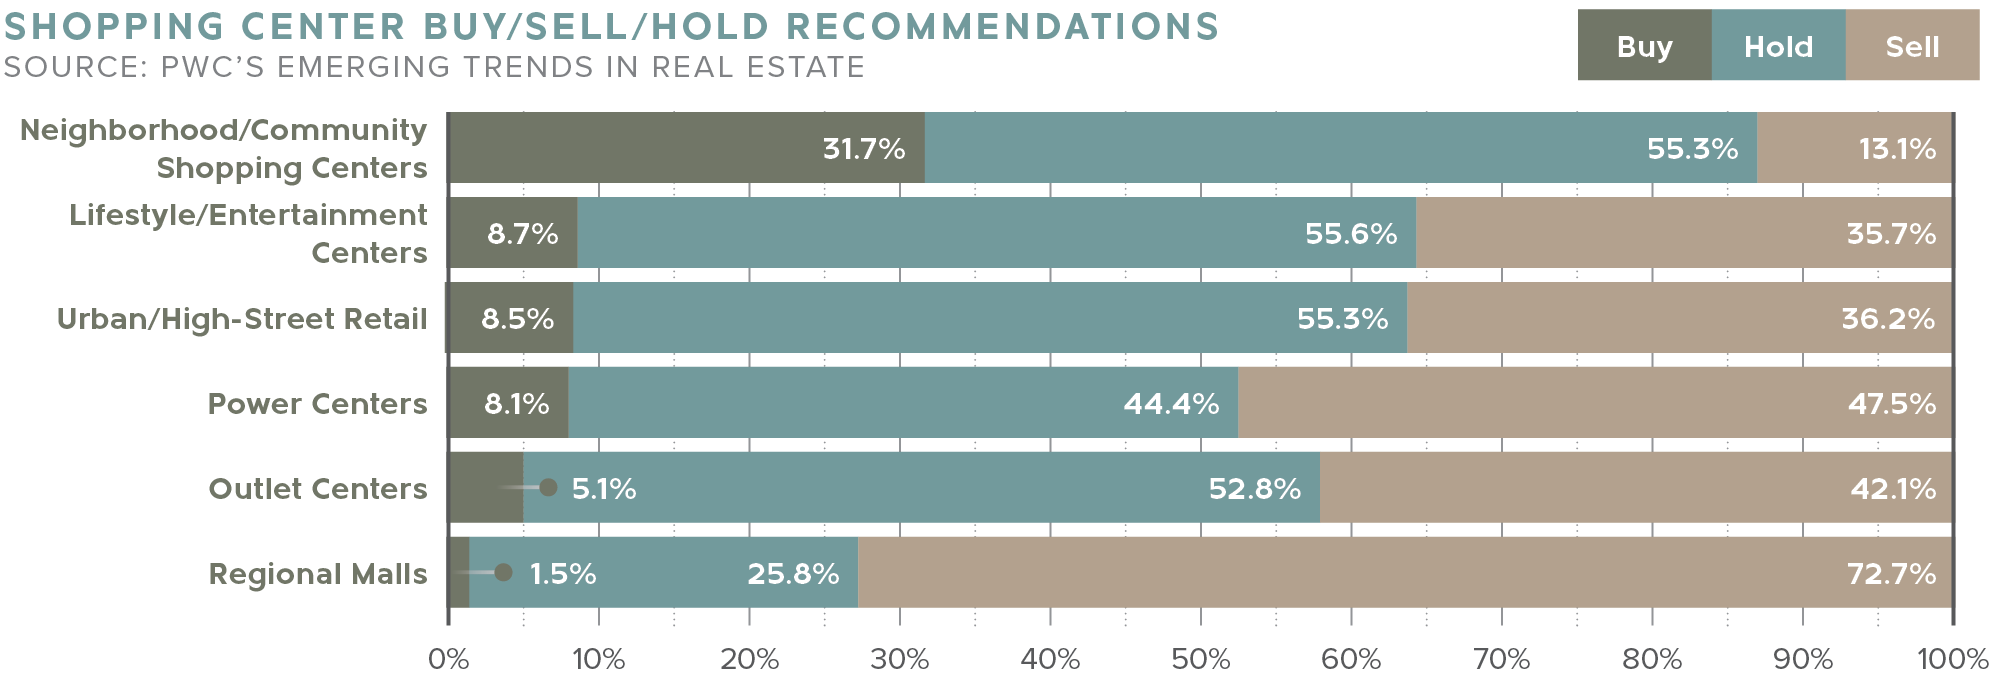
The Future of Shopping Malls
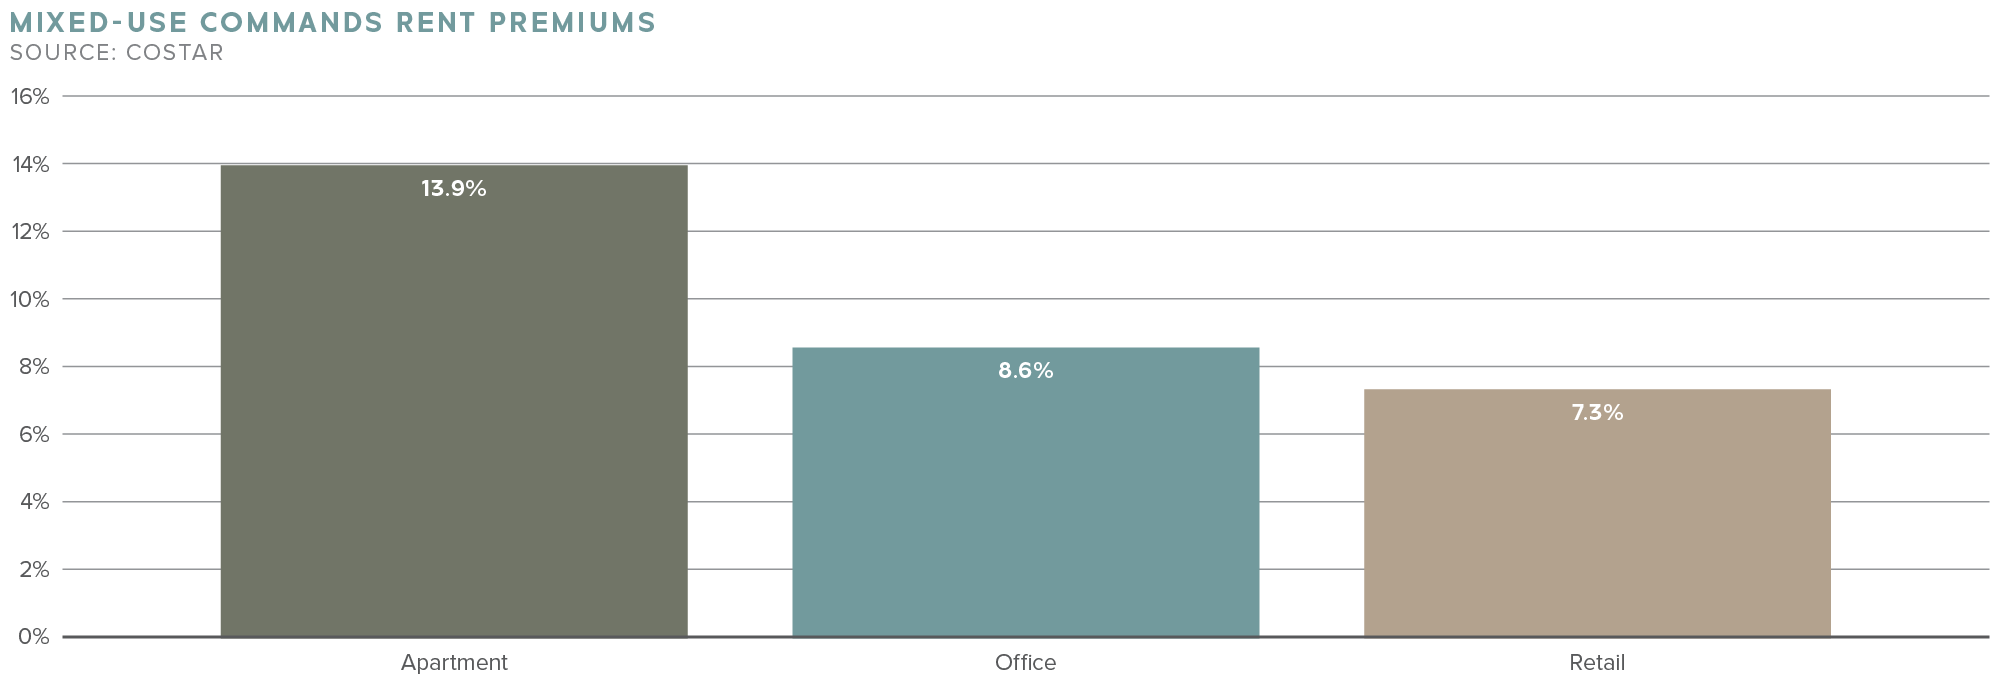
While the short-term outlook for shopping malls is grim, it isn’t all bad news. Companies are taking advantage of the ample square footage, accessibility, and desirable location of these abandoned malls. According to Moody’s Analytics, tearing down the real estate adds between $4 to $8 per square foot to project costs, extends the time on the permitting and execution process, and inflates development costs. As a result, malls are being repurposed into mixed-use and adaptive reuse projects rather than scraping the structure entirely. In addition to retaining a retail component, mall landlords are adding residential units, office space, or hotels to their assets to bolster revenues and rents. This allows landlords to command an average elevated rent of 13.9 percent in apartments, 8.6 percent for offices, and 7.3 percent for retail suites compared to non-mixed-use properties.
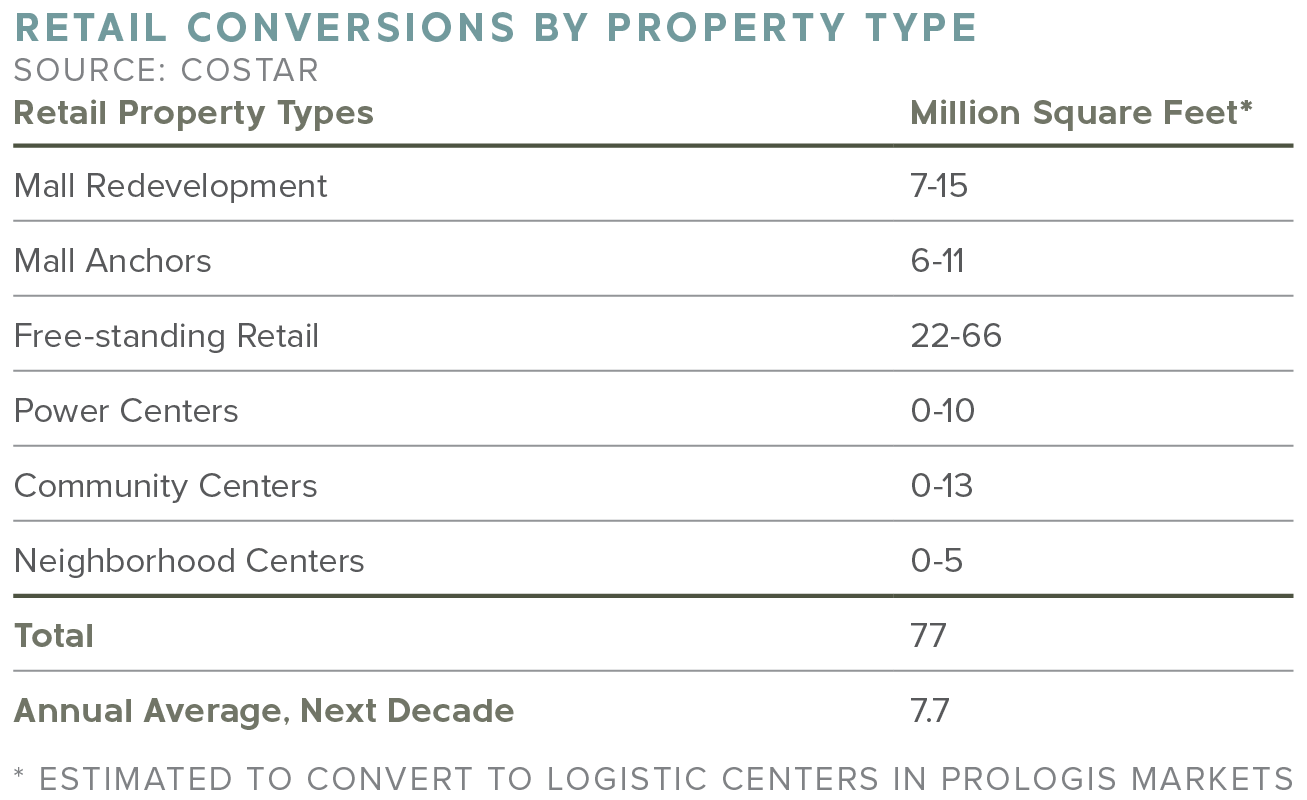
In other cases, malls are being retrofitted into industrial and logistics buildings. As e-commerce sales continue to grow, the demand for logistics correlates. Even Amazon has taken an interest, as the e-commerce giant makes headlines with converting unused mall spaces to distribution centers. Additionally, the online retailer is in talks with Simon Property Group, the nation’s largest mall owner, to convert bankrupt JCPenney and Sears department stores to fulfillment centers.

For more information, please contact a Matthews™ specialized agent today.


