AuthorGrant Steinberg
Senior AssociateFort Lauderdale, FL
Florida retail has remained adaptable amid economic uncertainty and rapid changes in consumer behavior. Demand for higher cap rate shopping centers is as strong as ever in South Florida as investors seek to hedge higher interest rates and inflation. In the last 12 months, Broward County and Palm Beach County’s retail leasing activity has slowed, from the peak levels seen in Q3 2021. This slowdown can be attributed to a contraction in available space for lease. Palm Beach County is a highly liquid investment market characterized by heavy trading, while the Broward County retail market is one of the largest in the country.
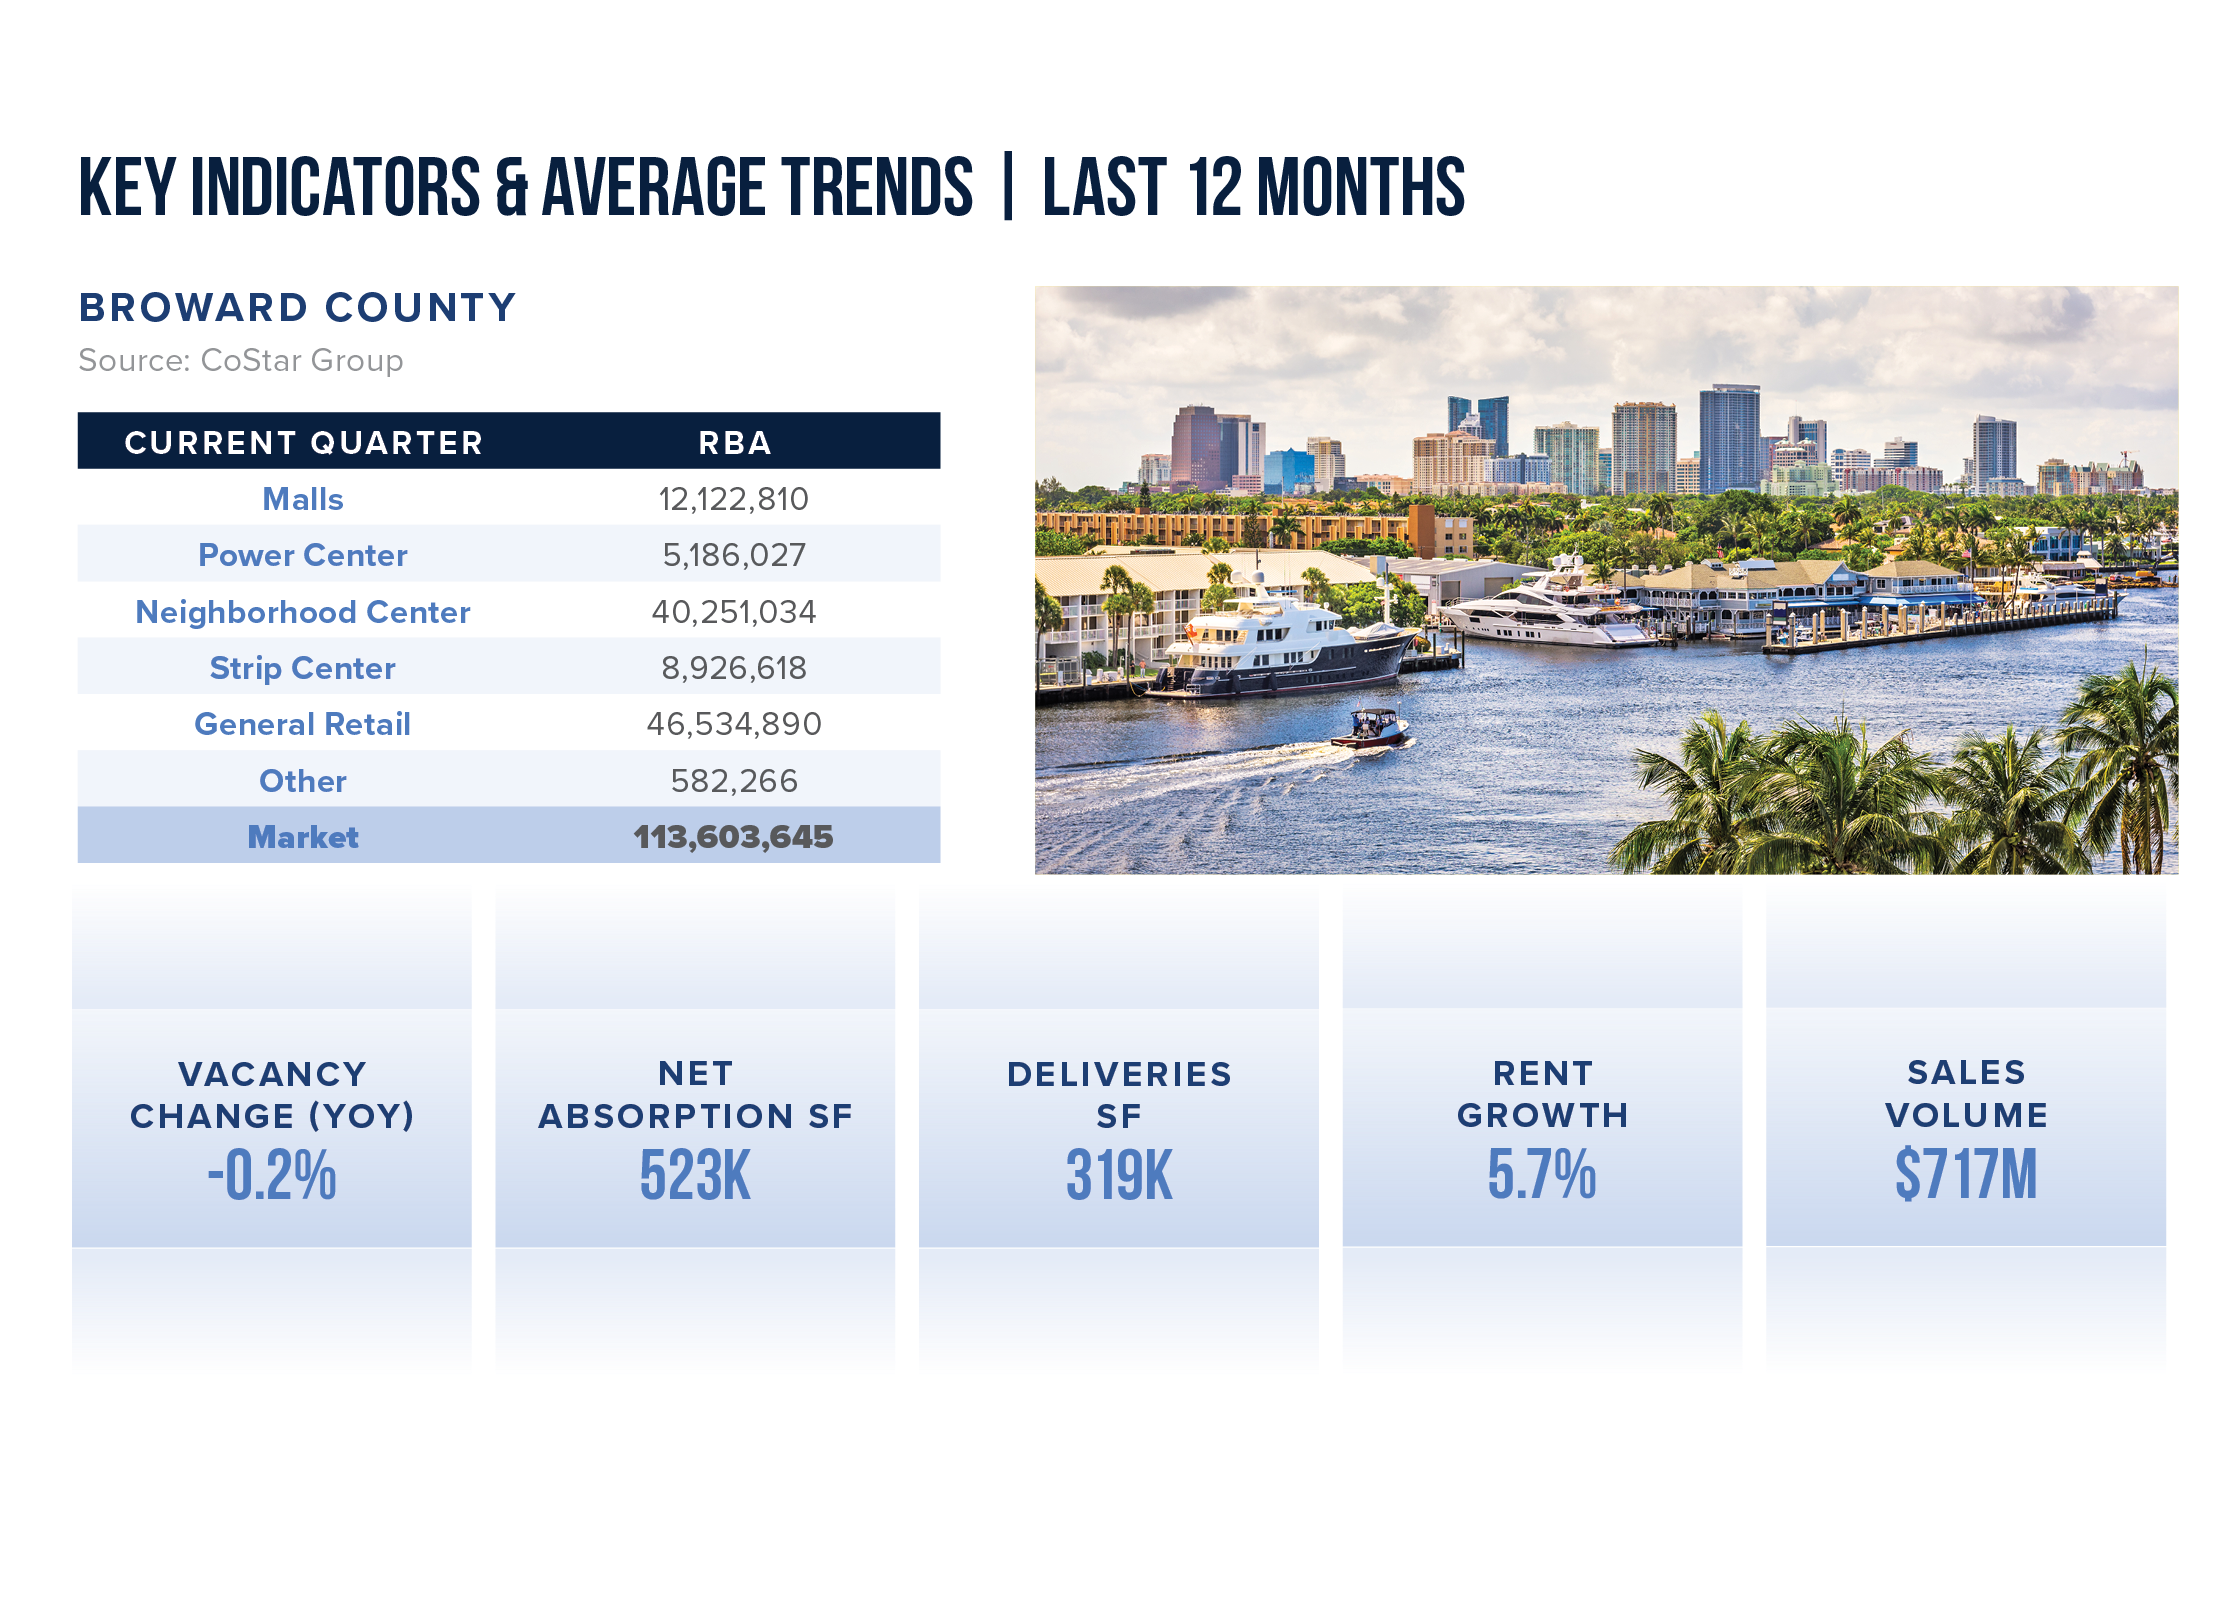
The yearly net absorption in Broward County remains robust, totaling 860,000 square feet, surpassing the five-year average annual absorption rate of 490,000 square feet. However, this represents a decrease from the peak net absorption recorded in Q1 2022, which exceeded 1.7 million square feet. The limited availability of existing space continues to impede absorption gains until the introduction of new properties. There is 4.5 million square feet of available space, a reduction from the five-year average of 5.7 million square feet.
As of Q4 2023, retail rents in Broward County stand at $34.00 per square foot, ranking as the third-highest in Florida markets, following Miami and Palm Beach. The remarkable rent growth has been primarily propelled by strip centers and other retail subtypes, experiencing annual rent increases surpassing 27% for these centers since 2020. Restricted space availability, along with a slowdown in immigration and job growth, is leading to a stabilization in demand. Despite this, vacancies are anticipated to stay below 4% due to the county’s constrained supply additions, which are expected to remain limited as construction starts to decrease.
The retail construction pipeline in Broward County is constrained due to a significant decline in construction starts since 2019. However, 510,372 square feet of new retail space are under construction, and 250,000 square feet have been delivered in the last 12 months.
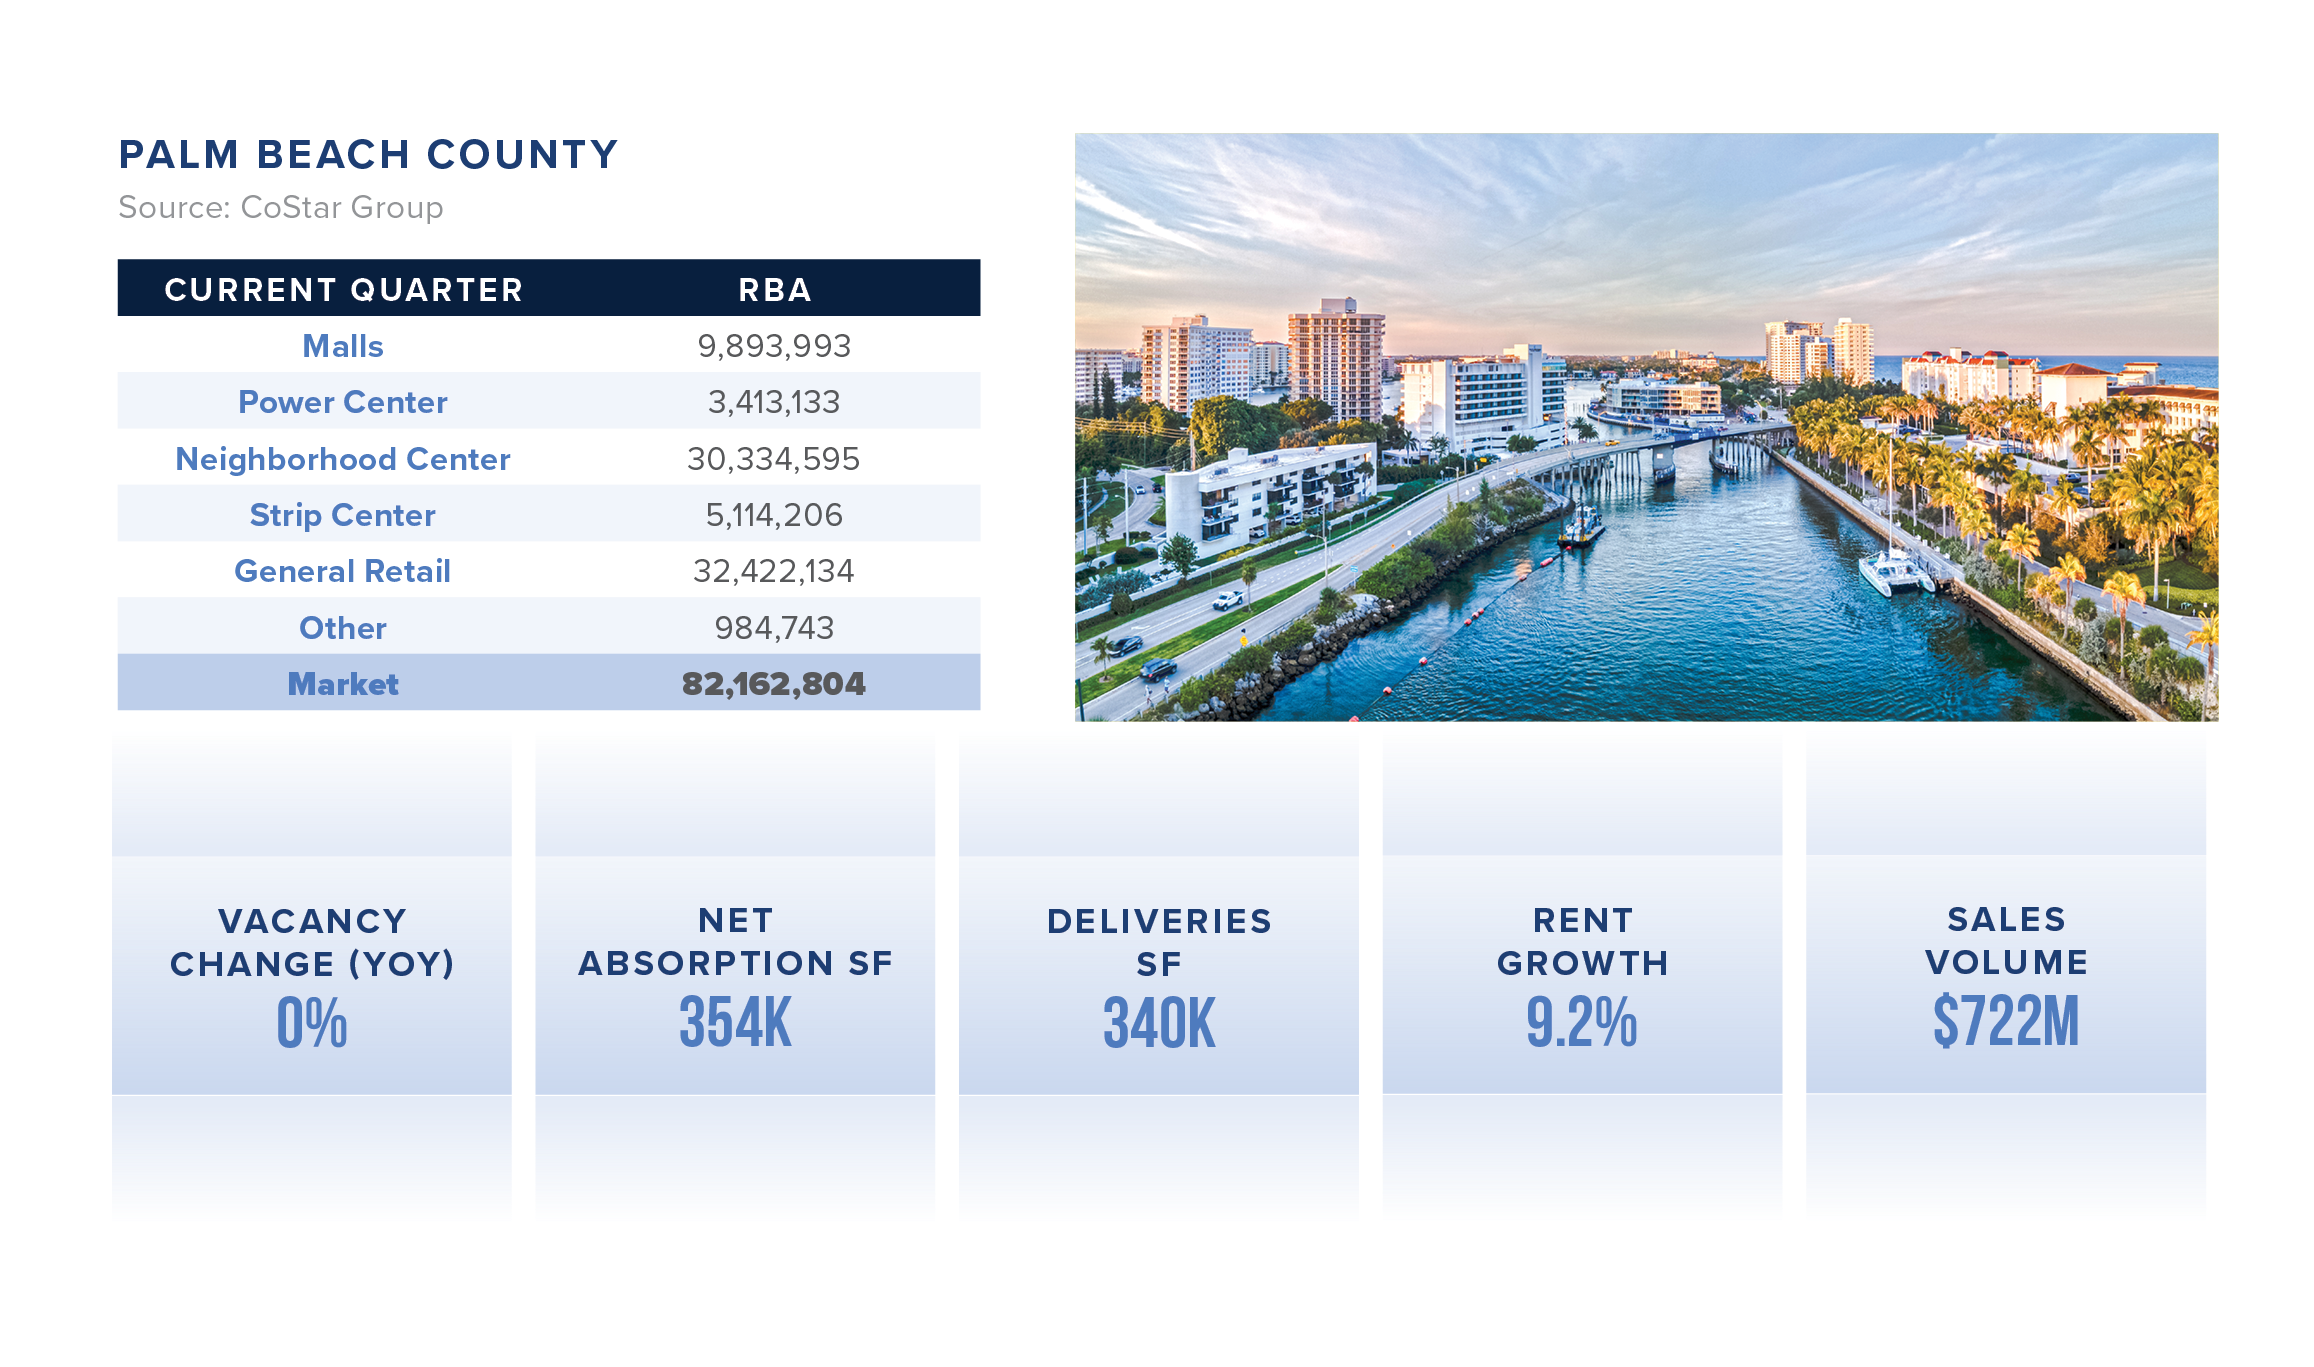
Palm Beach County’s yearly net absorption has decelerated, with 370,000 square feet absorbed, falling short of the five-year average annual absorption of 450,000 square feet. Vacancy rates are anticipated to stay low, increasing by less than one percentage point for most submarkets and approximately 0.3 percentage points for the entire Palm Beach County area until 2025.
As of Q4 2023, retail rents in Palm Beach are approximately $35.00 per square foot, ranking as the second-highest among all Florida markets, trailing behind Miami. Rent growth remains robust, with annual increases at about 9.2%, surpassing the five-year historical average growth of 5.9%. The outperformance in rent growth has led to an expanding rent premium compared to the U.S. average asking rents, rising from around 26% higher in 2020 to over 40% higher today. This notable rent growth has been primarily propelled by strip centers, neighborhood centers, and general retail, experiencing rent increases surpassing 26% for these centers since 2019.
The retail construction pipeline in Palm Beach continues to be restricted, with construction starts consistently at or below the 10-year average of approximately 600,000 square feet since 2016. However, about 560,000 square feet of new retail space is in progress, and about 330,000 square feet have been delivered in the last 12 months.
Broward County transaction volume has decelerated, amounting to slightly over $704 million in trades over the past 12 months, falling below the five-year annual average of $1.1 billion. In contrast, the first three quarters of 2022 saw over $1.2 billion in trades.
The transaction volume has decelerated, totaling slightly over $629 million in trades during the initial three quarters of 2023. This figure is considerably lower than the $1.2 billion traded during the same period in 2022 but aligns with the ten-year average of $622 million over the corresponding timeframe.