
Shopping Centers Market Report | Pinellas County, Florida
Pinellas County, Florida Shopping Centers Market Report
Pinellas County Market Overview
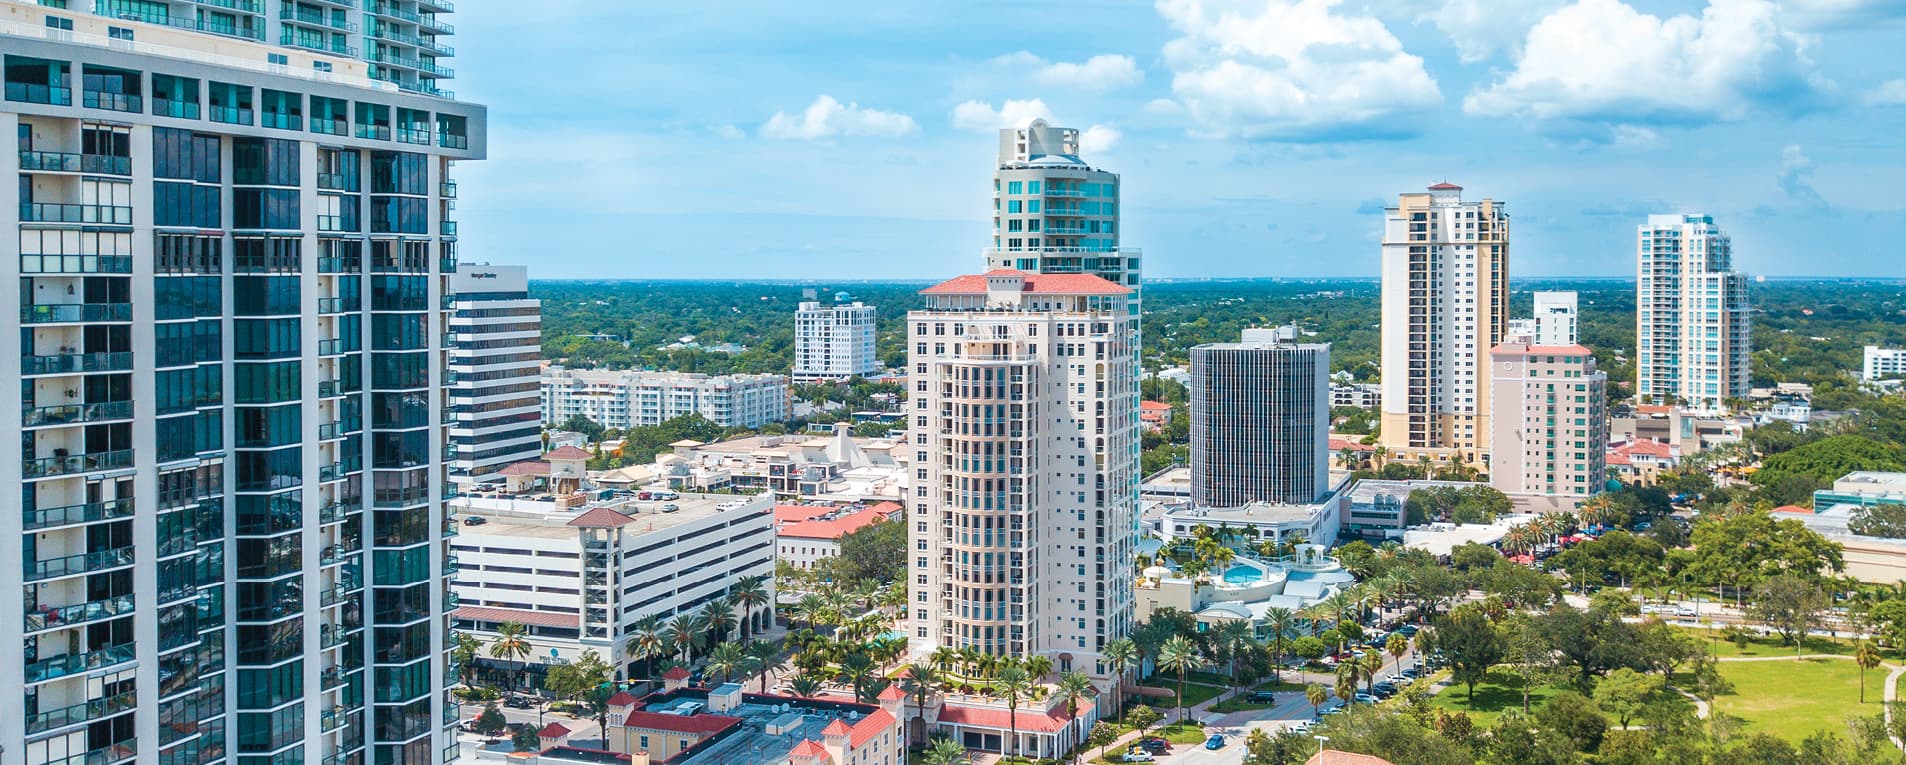
Pinellas County, situated along Florida’s Gulf Coast, is recognized for its scenic landscapes and diverse municipalities, including prominent locales such as Clearwater, St. Petersburg, and Dunedin. The county’s appeal extends beyond its cultural offerings to encompass outdoor recreational activities, with pristine beaches, water sports, and nature preserves providing ample opportunities for leisure and exploration. The following report highlights the retail market performance in Downtown St. Petersburg and Clearwater.
Downtown St. Petersburg
By the Numbers Last 12 Months
Source: CoStar Group
- Vacancy Rate: 5.1%
- Rent Growth: 8.4%
- Deliveries SF: 0
- Sales Volume: $10.1M
Market Overview
Downtown St. Petersburg, situated on Florida’s Gulf Coast, is a dynamic urban center known for its cultural vibrancy and waterfront setting. This bustling city hub boasts captivating views of both Tampa Bay and the Gulf of Mexico. The area offers diverse activities and attractions, from world-class museums like the Salvador Dali Museum to a wide array of restaurants and cafes. With 2.1 million square feet, downtown St. Petersburg is one of Tampa’s smallest retail centers.
Market Performance
In recent quarters, the increase in vacant retail spaces has been driven by several tenants leaving, resulting in a negative absorption of 44,000 square feet over the last 12 months. By Q4 2023, the vacancy rate in this submarket stands at 5.1%, a YOY increase of over 100 basis points. Despite a drop in demand for retail space, the asking rents have gone up by 8.4% YOY, now reaching $38.00 per square foot. Downtown St. Petersburg is considered one of the pricier retail areas in Tampa, commanding a premium of roughly 30% over the market’s average rate of $25.00 per square foot. However, it’s expected that the growth in asking rents will slow down in the coming quarters, possibly falling below an annual growth rate of 2% by early 2025.
Year-to-date sales volume has been low, with less than $5 million in total sales volume. The highest YTD transaction was a $1.7 million exchange of a 5,200 SF building in May for $330 per square foot. At the time of sale, the building sold for a 10% premium over the submarket average price per SF.
Downtown Clearwater
By the Numbers Last 12 Months
Source: CoStar Group
- Vacancy Rate: 1.0%
- Rent Growth: 6.6%
- Deliveries SF: 6.5K
- Sales Volume: $8.1M
Market Overview
Downtown Clearwater is the city’s central area, featuring a mix of shops, restaurants, and cultural spots. It’s a lively part of town, offering a variety of activities and a waterfront promenade with scenic views of Clearwater Harbor.
Market Performance
The retail submarket in Downtown Clearwater is almost fully occupied, with only 1.0% of available space currently vacant. In the last year, the vacancy rate has dropped by 0.5%, with 15,000 square feet of space being absorbed and 6,500 square feet of new space being delivered. Rental rates are approximately $23.00 per square foot, representing a 6.6% increase from a year ago and a cumulative 23.4% increase over the past three years. Currently, there is no new construction underway, and in the past year, five sales have been in the market. Over the last three years, there have been 27 sales, amounting to approximately $38.8 million, with a market cap rate of 6.4%, slightly below the three-year average of 6.7%.


