Matthews Logo

Navigation Menu

Market Intel

Image of The Store Is Not the Platform | How CVS’s Healthcare Strategy is Repricing Legacy Real Estate Risk Success Story

The Store Is Not the Platform | How CVS’s Healthcare Strategy is Repricing Legacy Real Estate Risk

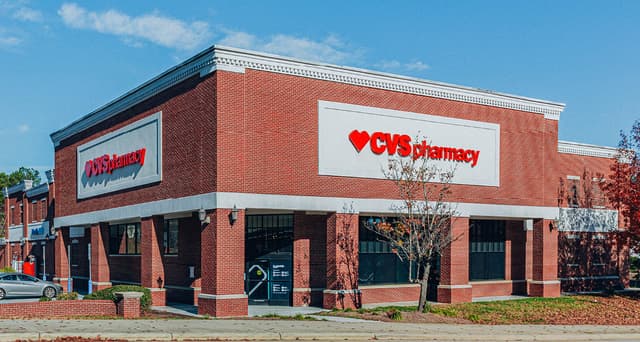
CVS Health is no longer best understood as a pharmacy retailer. The company now operates an integrated healthcare platform spanning insurance, pharmacy benefits, care delivery, medication fulfillment and consumer health engagement. That broader platform has materially changed how investors should evaluate the real estate beneath the CVS name.   The distinction matters because the healthcare platform does not depend on the freestanding 11,000 to 15,000 square foot drugstore format that remains common across 1031 exchange portfolios. CVS needs prescription density, patient access and clinical service capacity. It can increasingly deliver those functions through smaller, lower-cost and more flexible locations. The platform can strengthen while the legacy box becomes less essential. For owners, that creates a format risk the market may still be underpricing. Understanding the CVS Healthcare Platform CVS Health combines businesses that historically operated as separate parts of the healthcare system. Aetna provides commercial, Medicare, Medicaid, dental and behavioral health coverage. CVS Caremark manages prescription drug benefits for employers, health plans and government clients. MinuteClinic, Oak Street Health and Signify Health extend care delivery through clinics, primary care centers, virtual platforms and patients’ homes. CVS Pharmacy provides the physical medication and consumer health infrastructure that connects those businesses to local markets.   As of March 31, 2026, CVS Health operated approximately 9,000 retail pharmacy locations, more than 1,000 walk-in and primary care clinics, and a pharmacy benefits platform serving approximately 88 million members. The company also provided health insurance products and related services to more than 37 million people.   That scale supports the credit story, but it should not be confused with support for every legacy store. Most of the value embedded in CVS’s healthcare strategy comes from access, prescription volume and patient relationships, not from maintaining a standardized freestanding retail footprint. Proximity Is the Asset, Not the Box The strategic value of CVS Pharmacy begins with proximity. CVS reports that approximately 85 percent of Americans live within 10 miles of one of its pharmacies, and the company estimates that its businesses collectively connect with approximately 185 million consumers.   CVS is protecting that access network, not a fixed amount of square footage. A pharmacy counter, vaccination capacity and a focused health and wellness assortment can preserve much of the location value in a materially smaller footprint. Once investors separate location value from format value, the case for retaining every legacy box becomes less durable.   Pharmacy visits also occur more frequently than most healthcare interactions, particularly for patients managing chronic conditions. That repeat traffic is strategically valuable to CVS. It does not require an 11,000 to 15,000 square foot building to capture it. CVS Is Shrinking the Retail Footprint CVS is moving toward a more flexible real estate model. Traditional stores still combine pharmacy operations with health, beauty, convenience and seasonal merchandise, which is the format most freestanding NNN investors own today. But the company now operates across a wider range of formats, and the legacy box is no longer the only template for growth.   CVS operates pharmacies inside Target and other retailers, culturally focused formats such as CVS Pharmacy y Mas, and locations integrated with MinuteClinic or Oak Street Health services. In 2026, the company also began introducing smaller pharmacy-only locations of roughly 3,000 square feet centered on prescriptions, immunizations and pharmacist services. CVS announced plans for nearly 20 of these apothecary-style locations during the year, including sites in Chicago, Houston, Detroit, Brooklyn, Roxbury and other markets.   The direction is consistent with the broader portfolio reset. CVS has closed roughly 1,100 net store locations over the past four years while testing a smaller format that preserves healthcare access with less occupancy cost and less capital intensity. For real estate investors, that is direct evidence that the company can separate the value of a market from the value of the legacy building serving it. Tennessee Makes the Strategic Tradeoff Clear Tennessee’s recent PBM reform provides one of the clearest examples of how CVS prioritizes the broader healthcare platform relative to its physical store network. The state’s FAIR Rx Act restricts companies from simultaneously controlling a pharmacy, a pharmacy benefit manager, and a health insurer, directly challenging CVS Health’s vertically integrated structure across CVS Pharmacy, Caremark, and Aetna.   CVS responded by warning that the legislation could result in the closure of all of its Tennessee pharmacies, along with more than 25 MinuteClinic locations. The company subsequently challenged the law in federal court. Rather than suggesting it would separate from Caremark or Aetna to preserve the existing retail footprint, CVS has framed the potential consequence as the loss of its Tennessee pharmacy locations.   The economics of the broader company help explain why that distinction matters. CVS’s Health Care Benefits and Health Services segments generate significantly more operating income than its Pharmacy & Consumer Wellness segment. Health Services includes CVS Caremark and the company’s care delivery businesses, while Health Care Benefits includes Aetna. The comparison reinforces the growing importance of CVS’s healthcare and PBM operations relative to its traditional retail footprint. Format Risk Is Becoming Real Estate Risk CVS Health’s segment reporting shows sustained pressure on the front-store retail business, while pharmacy reimbursement and PBM regulation continue to tighten operating economics. The FTC consent order involving Caremark and state-level PBM legislation in markets including Arkansas, Tennessee and Oklahoma increase the incentive to operate more efficiently. A smaller, clinically focused footprint fits that objective without weakening the healthcare platform.   For owners of legacy freestanding CVS stores, the issue becomes most relevant at lease rollover. At the end of a 15 to 20-year lease term, CVS does not need to choose between remaining in the market and leaving it. The company can remain in the trade area while reducing its footprint from 12,000 square feet to 3,000 square feet. That flexibility introduces a credible non-renewal risk for properties where the existing box is larger or more expensive than the operating model requires.   The 1031 market has historically priced CVS net-lease assets primarily on tenant credit and remaining lease term. That framework made more sense when the standardized freestanding box was the dominant operating format. It is less complete today. If CVS can deliver comparable healthcare access through a much smaller location, investors need to underwrite building-level renewal probability alongside corporate credit. The roughly 100-basis-point cap-rate spread between CVS and Walgreens reflects a credit differential, but it may not fully account for format risk. Implications for Owners CVS should increasingly be underwritten as a healthcare occupier, but the analysis still needs to occur at the property level. Prescription density, patient access, local market position, rent basis, remaining options and alternative-use value matter more than broad assumptions about the strength of the corporate platform. A strong CVS credit profile does not eliminate renewal risk for an oversized or economically inefficient location.   Near-term lease expirations deserve the most scrutiny. CVS can preserve market access without preserving the existing building, and owners should price that risk before rollover.

Image of Brandon Doblie Author

Brandon Doblie

Associate

Image of Houston, TX Retail Market Report Q2 2026 Success Story

Houston, TX Retail Market Report Q2 2026

Houston’s retail market recorded mixed operating results in Q2 2026 as tight vacancy contrasted with negative net absorption. The vacancy rate stood at 5.5%, indicating that available retail space remained relatively limited across the metro despite some tenant move-outs. Net absorption totaled negative 478,000 square feet, signaling a temporary pullback in occupied inventory during the quarter. The decline could reflect store closures, relocations, or timing differences between tenant departures and new lease commencements rather than a broad deterioration in demand. Asking rents reached $24.96 per square foot, supported by limited availability in well-located centers and higher ownership costs. Rent growth measured 1.9%, showing that landlords retained some pricing power even as absorption weakened. Well-positioned properties in established trade areas should remain better insulated from softer leasing conditions because retailers continue to prioritize locations with strong traffic and consumer density. Key Findings Houston’s retail fundamentals stayed relatively tight during the second quarter, although negative absorption signaled some near-term softening in tenant demand. A sizable construction pipeline points to continued developer confidence, but new supply could create more competition for tenants as projects deliver. Investment activity remained active, while elevated cap rates reflected a pricing environment that still favors disciplined underwriting and selective acquisitions. Houston Retail Supply & Demand Dynamics Source: CoStar Group, Inc.   Houston Demographics Source: Oxford Economics Unemployment Rate: 4.6% Current Population: 7,996,188 Households: 2,858,087 Median Household Income: $83,624   Houston’s economy entered the second quarter of 2026 with a diverse demand base supporting the retail sector. Population and household growth continued to expand the region’s consumer base, particularly across suburban growth corridors. Employment conditions also provided an important foundation for retail spending, although consumers remained sensitive to elevated living costs and broader economic uncertainty. The energy sector continued to influence regional business activity, but Houston’s expansion across healthcare, logistics, manufacturing, and professional services reduced its dependence on a single industry. Household formation and residential development supported retail demand in emerging suburban communities where population growth has outpaced existing commercial supply. At the same time, higher borrowing costs constrained some business expansion and increased occupancy costs for retailers pursuing new locations.   Top Retail Leases Source: CoStar Group, Inc. 22020 West Rd – 134,808 SF Center at Baybrook – 133,560 SF Population, Labor Force, & Income Growth Source: Oxford Economics   Houston Retail Construction Development activity reflects confidence in the metro’s demographic expansion and the need for additional retail services in fast-growing residential areas. Houston had approximately 4.2 million square feet under construction at the end of the second quarter, creating a meaningful pipeline of future retail inventory. Builders have generally focused new projects in suburban corridors where household growth can support grocery-anchored centers, service retail, restaurants, and other necessity-oriented concepts. Only 3,700 square feet delivered during the quarter, leaving the market with minimal immediate supply pressure from completed projects. The gap between quarterly deliveries and the construction pipeline indicates that a larger volume of space could enter the market over coming quarters as projects reach completion. SF Construction Starts Source: CoStar Group, Inc.   SF Under Construction Source: CoStar Group, Inc.   Houston Retail Sales Houston recorded approximately $232 million in retail sales volume during Q2 2026 as investors remained active despite a challenging capital markets environment. Properties traded at an average $255 per square foot, reflecting investor demand for retail assets with durable tenancy and strong locations. The average cap rate measured 7.3%, offering a wider yield than investors typically accepted during the low-interest-rate environment earlier in the cycle. Higher financing costs continued to influence pricing and encouraged buyers to emphasize current cash flow, tenant credit, lease duration, and potential capital requirements. Grocery-anchored centers, necessity retail, and properties in high-growth suburban trade areas likely attracted the strongest investor interest as buyers prioritized predictable income. The wider cap-rate environment may also create acquisition opportunities for investors with available equity and longer investment horizons. Sellers, however, may remain reluctant to transact when current pricing falls below expectations established during the previous market cycle. This disconnect could limit transaction velocity even as investor interest persists. Sales Volume Source: CoStar Group, Inc.   By the Numbers Q2 2026 | Source: CoStar Group, Inc. Sales Volume: $232M Price Per SF: $255 Cap Rate: 7.3% Vacancy Rate: 5.5% Rent Growth: 1.9% Asking Rent Per SF: $24.96 SF Under Construction: 4.2M SF Delivered: 3.7K SF Absorbed: -478K

Image of Houston, TX Multifamily Market Report Q2 2026 Success Story

Houston, TX Multifamily Market Report Q2 2026

Multifamily Investors Chase Houston’s Wide Cap Rates Growth Stays Underwater Demand Rent is still loosing ground. Effective rent fell to $1,327 in Q2, down 1.0% YoY, the second straight year of outright decline. But the leasing numbers underneath that headline look considerably better. Net absorption of 8,957 units ran nearly 49% ahead of last year’s pace, enough to pull vacancy down to 6.19%, even though it’s still up 44 bps from a year ago. That’s the split defining Houston right now, a market absorbing units at a healthy clip while still working off enough excess supply that pricing power hasn’t caught up.   Supply The delivery pipeline is unwinding. The TTM completions dropped 38.4% to 11,542 units, a steep comedown from the 24,869 delivered at the peak of the cycle in 2024. Curiously, Q2 completions actually rose 37.5% YoY to 3,443 units. However, units under construction have fallen to 21,129, just 2.63% of inventory, the lowest share since well before the current cycle began.   Investment Market Houston is drawing capital back for a simple reason: it’s one of the widest cap rate markets in the nation. At 6.28%, Houston’s cap rate trails only Columbus, and it’s climbed for eight straight quarters even as price per unit has edged up alongside it to $142,420. TTM volume is up 19.4% to $6.0B, through Q2 alone came in soft at $946M, down 38.6% YoY. This kind of choppy quarter-to-quarter volume that’s common when investors are still testing a market’s floor.   Volume $6.0B TTM volume (+19% YoY) Q2 2026: $946M Series peak $18.3B (2021) Pricing Cap rate 6.28% Price per unit $142k Caps expanding 18 quarters running

Image of Houston, TX Industrial Market Report Q2 2026 Success Story

Houston, TX Industrial Market Report Q2 2026

Houston’s industrial market continues to transition toward a more balanced environment following several years of exceptional expansion. The market recorded 7.3% vacancy, an increase driven primarily by new speculative deliveries exceeding tenant demand. Net absorption totaled 6.9 million square feet, demonstrating continued leasing activity but remaining below the pace of new supply. Annual asking rent growth declined 0.8%, marking the first period of negative rent growth in more than a decade as landlords compete more aggressively for tenants. Modern logistics facilities continue to outperform older inventory, benefiting from occupier preference for higher clear heights, improved functionality, and greater operational efficiency. Tenant incentives, including free rent and larger tenant improvement (TI) packages, have become increasingly common, particularly for larger warehouse space.       Key Findings IOS and crane served manufacturing remains tight with elevated lease rates. Houston’s industrial market remains fundamentally active, but new supply continues to outpace demand, resulting in higher vacancy and tenant leverage. Modern bulk distribution facilities face strong leasing activity while older and smaller facilities face softer demand. Investment activity remained resilient as improving lending conditions and stabilizing cap rates continued to support buyer interest despite softer operating fundamentals.   Houston Industrial Supply & Demand Dynamics Source: CoStar Group, Inc.   Houston Demographics Source: U.S. Bureau of Labor Statistics Unemployment Rate: 4.1% Current Population: 7,904,627 Households: 2,768,708 Median Household Income: $82,268   Home to approximately 8 million people, Houston is the fifth-largest metro in the United States.   Houston’s economy continues to provide a strong foundation for industrial real estate. The regional economy remains highly diversified, extending well beyond its traditional energy base into healthcare, aerospace, advanced manufacturing, logistics, and petrochemicals. The Port of Houston continues to serve as one of the nation’s most important freight gateways, supporting long-term warehouse and distribution demand. Employment growth has slowed compared with the post-pandemic recovery period, though healthcare and construction continue to generate new jobs. Manufacturing and professional services have experienced softer hiring activity, reflecting broader economic uncertainty. Houston’s business-friendly environment, favorable tax structure, and relatively affordable housing continue to attract both employers and residents.   Houston Remains the Top Exporting US Metro Source: International Trade Association Houston’s industrial market posted a disclosed sales volume of $104M in Q2 2026. Source: CoStar Group, Inc.

Image of Doc Perrier Author

Doc Perrier

First Vice President & Director

Image of Houston, TX Medical Office Market Report Q2 2026 Success Story

Houston, TX Medical Office Market Report Q2 2026

Houston’s medical office market remained relatively balanced during Q2 2026, though leasing activity softened modestly during the quarter. Vacancy improved to 16.3%, continuing its gradual decline from 2025 highs, while asking rents averaged $30.55 per square foot despite a slight 0.8% annual decline. Development activity remained subdued, with only 85,510 square feet under construction, helping limit additional supply. Investment activity remained steady as 72 properties traded during the quarter, reflecting continued investor interest despite a higher interest rate environment.   Key Findings Leasing conditions remained stable as medical office vacancy held at 15.7%, while a limited development pipeline of just 85,510 SF under construction helped keep future supply growth in check. Rental fundamentals continued to strengthen as limited clinical availability supported average asking rents in the $25–$30 PSF NNN range, with top-tier Class A medical office properties continuing to command premium lease rates. Healthcare systems continued expanding their outpatient footprints across high-growth suburban markets, with providers such as Kelsey-Seybold, Memorial Hermann, and Houston Methodist driving new development in Cypress, Katy, and Fort Bend County to meet growing patient demand.   Houston Demographics Source: Oxford Economics Unemployment Rate: 4.7% Households: 2,865,924 Current Population: 8,020,722 Median Household Income: $83,325   Rents Average asking rents reached $30.55 per square foot during Q2 2026, representing a 0.8% year-over-year decline. While annual rent growth remains modestly negative, the historical trend shows rents have generally held near the $30 per square foot range over the past several quarters, suggesting pricing has largely stabilized following several years of expansion.   Vacancy The vacancy rate declined to 15.4% in Q2 2026, extending the gradual stabilization that began late last year. Historical trends show vacancy has eased from its recent peak as new deliveries slowed, although negative quarterly absorption indicates leasing demand softened during the period. Even so, the limited construction pipeline should continue supporting market fundamentals over the coming quarters.   Vacancy Rate Source: CoStar Group, Inc. Construction Development activity continued to slow, with just 85,510 square feet under construction and 26,520 square feet delivered during the quarter. The construction graph illustrates a dramatic pullback from the nearly 2.0 million square feet underway in 2023 and 2024, indicating developers have significantly reduced new starts as the market works through recent supply additions.   SF Under Construction Source: CoStar Group, Inc.   Sales The Houston medical office investment market recorded 72 sales during Q2 2026, with properties trading at an average of $299 per square foot. Average cap rates increased to 6.9%, reflecting more conservative pricing and higher return expectations amid today’s financing environment. Despite that shift, transaction activity remained healthy, underscoring continued investor demand for well-located healthcare assets with durable occupancy fundamentals.   Cap Rates Source: CoStar Group, Inc. By the Numbers Q2 2026 | Source: CoStar Group, Inc. # of Sales: 72 Cap Rate: 6.9% Price Per SF: $299 Vacancy Rate: 15.4% Rent Growth: -0.8% Asking Rent Per SF: $30.55 SF Under Construction: 85.5K SF Delivered: 26K SF Absorbed: 75K

Image of Andrew Richmond Author

Andrew Richmond

Senior Associate

Image of Houston, TX Industrial Market Report Q1 2026 Success Story

Houston, TX Industrial Market Report Q1 2026

Houston’s industrial market showed mixed performance in Q1 2026, as solid leasing activity was offset by rising vacancy and slowing rent growth. Net absorption totaled 3.2 million SF, improving from 2025 but still trailing deliveries. Leasing remains above historical norms, driven by large-format users prioritizing modern facilities. Vacancy reached 7.4%, increasing as supply continues to outpace demand, particularly in big-box assets. Older properties are facing hurdles as tenants shift to newer space. Rent growth slowed to 1.3% annually, with concessions becoming more common. Concessions have expanded meaningfully, including increased free rent and tenant improvement packages, particularly for large spaces. While asking rents remain elevated relative to historical levels, landlord pricing power has weakened. Overall, market conditions are transitioning toward equilibrium, with tenants gaining leverage in lease negotiations.   Key Findings Vacancy continued to rise as sustained supply deliveries outpaced demand, with additional upward pressure expected near term. Leasing activity remains healthy overall, but a clear flight-to-quality trend is reshaping demand toward newer, large-format assets. Elevated construction and growing concessions are tempering rent growth, signaling a more tenant-favorable environment.   Houston Industrial Supply & Demand Dynamics Source: CoStar Group, Inc.   Houston Demographics Source: CoStar Group, Inc. Unemployment Rate: 4.6% Households: 2,836,320 Current Population: 7,946,883 Median Household Income: $84,000   Houston’s economic backdrop remains supportive of long-term industrial demand, though near-term risks are increasing. The metro has added substantial population over the past several years, supporting household formation and consumption patterns that underpin logistics demand. Its role as a major distribution hub continues to expand, driven by port activity and global trade flows, particularly in energy-related exports such as polymers. Employment growth across manufacturing, logistics, and trade sectors has reinforced space needs, especially among large national users. Tenant decision timelines are lengthening, reflecting a more deliberate approach to expansion. Overall, the macro environment continues to support industrial fundamentals, but momentum has moderated compared with prior years.   Houston leads the nation in exports with $180.9B in goods and commodities sent abroad last year. 2025 | Source: Greater Houston Partnership   Top Metro Employment by Occupation 2025 | Source: Greater Houston Partnership   Houston Industrial Construction Development remains elevated, with 29 million SF underway and 4.5 million SF delivered in Q1. The pipeline is heavily concentrated in speculative, large-format logistics properties, much of which remains unleased. Inventory expansion in buildings over 100,000 SF has significantly increased supply in recent years. New development is concentrated in suburban and port-adjacent submarkets, where availability is highest. This has extended lease-up timelines, particularly for larger assets. In contrast, small-bay construction remains limited, supporting tighter conditions in that segment. Despite financing challenges, Houston continues to see strong development activity. The large volume of unleased space is expected to increase vacancy through 2026.   SF Construction Starts Source: CoStar Group, Inc.   SF Under Construction Source: CoStar Group, Inc.   Houston Industrial Sales Houston’s industrial market posted a sales volume of $77.1M in Q1 2026.   Sales Volume Source: CoStar Group, Inc.   By the Numbers Source: CoStar Group Inc. Sales Volume: $77.1M Cap Rate: 7.7% Vacancy Rate: 7.4% Rent Growth: 1.3% SF Under Construction: 29M SF Delivered: 4.5M SF Absorbed: 3.2M

Image of Doc Perrier Author

Doc Perrier

First Vice President & Director

Image of Austin, TX Medical Office Market Report Q1 2026 Success Story

Austin, TX Medical Office Market Report Q1 2026

Austin’s Medical Office Market continued to show signs of stabilization in Q1 2026 as the sector moved further away from the supply-driven pressure of prior years. While vacancy remained elevated at 12.2%, the market still posted 1.7% year-over-year rent growth, indicating that fundamentals are beginning to improve.   At the same time, investment activity remained active with 34 sales recorded during the quarter, while the development pipeline stayed well below the levels seen throughout 2023 and 2024. Taken together, these trends suggest the market is gradually regaining balance as supply pressures ease and overall performance becomes more stable. This continued moderation in new supply should help support healthier leasing conditions and more sustained market improvement in the quarters ahead. Key Findings Stabilizing Market Conditions: Austin’s medical office market showed signs of improving balance in Q1 2026, with 12.2% vacancy, 1.7% year-over-year rent growth, and a lower construction pipeline supporting more stable fundamentals. Reduced Development Pipeline: Construction activity totaled 131,005 SF, remaining well below the much higher levels seen throughout 2023 and 2024, easing future supply pressure. Stable Investment Activity: The market recorded 34 sales at an average 6.0% cap rate, reflecting continued investor interest and relatively stable pricing despite still-elevated vacancy levels. Houston Demographics Source: CoStar Group, Inc.   Unemployment Rate: 3.6% Households: 1,094,265 Current Population: 2,616,899 Median Household Income: $103,006 Rents Average asking rent reached $38.26 per SF in Q1 2026, with 1.7% year-over-year growth, highlights continued rent increases even as the market worked through elevated vacancy. That growth suggests landlord pricing has remained relatively stable despite broader occupancy pressure, and in a market recovering from heavy deliveries, even modest gains are still meaningful. With construction activity now well below prior peaks, Austin’s medical office market is better positioned to support steadier, healthier, more durable, and more sustainable rent growth moving forward.   Market Asking Rent Per SF Source: CoStar Group, Inc.   Vacancy Vacancy reached 12.2% in Q1 2026, remaining elevated as the market continues to absorb new supply delivered over the past several years. Leasing activity remained modest, with 852 SF of positive absorption recorded during the quarter, indicating that demand is still present but not yet strong enough to rapidly compress vacancy. However, with construction activity slowing considerably, the pace of new deliveries is no longer putting additional upward pressure on vacancy. Vacancy Rate Source: CoStar Group, Inc.   Construction Construction activity totaled 131,005 SF in Q1 2026, reflecting a slight increase from the prior quarter but remaining significantly below historical levels. The development pipeline has declined sharply from the 300K-700K+ SF range seen throughout 2022-2024, signaling a clear pullback in new projects. This sustained slowdown in construction reduces future supply pressure and allows existing space more time to lease. SF Under Construction Source: CoStar Group, Inc. Sales Sales activity remained steady in Q1 2026, with 34 transactions recorded and an average 6.0% cap rate, indicating continued investor interest in Austin’s medical office sector. Despite elevated vacancy, pricing has held relatively stable, reflecting confidence in the market’s long-term fundamentals. Deal volume at this level suggests buyers remain active and willing to transact, particularly as improving supply conditions create a more favorable outlook. Overall, the investment market continues to demonstrate resilience and stability heading into the remainder of the year. Cap Rate Source: CoStar Group, Inc. By the Numbers Q1 2026 | Source: CoStar Group, Inc. # of Sales: 34 Sales Growth (QOQ): 25.0% Price Per SF: $299 Vacancy Rate: 12.2% Rent Growth: 1.7% Asking Rent Per SF: $38.26 SF Under Construction: 131K SF Delivered: – SF Absorbed: 852

Image of Andrew Richmond Author

Andrew Richmond

Senior Associate

Image of Houston, TX Medical Office Market Report Q1 2026 Success Story

Houston, TX Medical Office Market Report Q1 2026

Houston’s medical office market is showing early signs of stabilization in Q1 2026 following a supply-driven softening throughout 2025. Vacancy remains elevated at 18.3%, though improving tenant demand is evident, with absorption of 140,104 SF outpacing 119,591 SF of new deliveries. This trend highlights continued occupier resilience even as the market works through recent supply additions. Construction activity has moderated significantly to 367,535 SF, helping to ease future supply pressure. Asking rents have softened slightly to $29.73 per SF, reflecting a -0.4% year-over-year decline and a shift toward more measured growth. Investment activity remains steady, with 71 sales at a 7.0% cap rate and pricing around $299 per SF, underscoring continued investor interest in the sector.   Key Findings Market Vacancy and Demand: Vacancy remains elevated at 18.3% but is showing early signs of stabilization, as absorption continues to outpace new deliveries. Improving demand is helping support occupancy and contributing to a gradual market adjustment. Rent Trends and Pricing: Vacancy remains elevated at 18.3% but is stabilizing as absorption outpaces new deliveries. Asking rents have edged down to $29.73 per SF (-0.4% YOY), while demand continues to support occupancy and rebalance the market. Development and Investment Activity: Construction activity has moderated to 367,535 SF, easing near-term supply pressure, while investment remains active with 71 sales at a 7.0% cap rate and $299 per SF. Capital continues to target well-positioned assets supported by stable demand fundamentals. Houston Demographics Source: CoStar Group, Inc. Unemployment Rate: 4.6% Households: 2,837,188 Current Population: 7,948,642 Median Household Income: $84,038 Rents Asking rents have begun to stabilize heading into Q1 2026 after several years of steady growth. Rates have largely plateaued in the low-$30 per SF range, averaging about $30.20 per SF, with modest fluctuations between the high-$28 and low-$30 range over the past year. This leveling reflects a normalization in pricing as new supply has eased landlord leverage, while rents remain elevated and supported by steady underlying demand.   Market Asking Rent Per SF Source: CoStar Group, Inc.   Vacancy Vacancy trended upward through 2025, reflecting the impact of new supply on occupancy. After peaking in the mid-15% range, vacancy has begun to stabilize, easing to roughly 14.0% in Q1 2026. While still elevated relative to prior periods, recent declines suggest demand is starting to absorb new deliveries. With improving absorption and a slowing development pipeline, vacancy is expected to continue stabilizing in the near term.   Vacancy Rate Source: CoStar Group, Inc.     Construction The Houston medical office development pipeline has contracted meaningfully heading into Q1 2026, falling to roughly 367,500 SF, its lowest level in several years. This marks a sharp pullback from peak construction activity near 2.0 million SF in 2023, as developers have scaled back new starts in response to rising vacancy and recent supply additions. The sustained decline throughout 2025 signals a more cautious development environment and a shift toward rebalancing supply and demand. With significantly less space underway, the market is better positioned to absorb existing inventory and stabilize fundamentals in the near term.   SF Under Construction Source: CoStar Group, Inc. Sales Transaction activity in the Houston medical office market moderated in Q1 2026, with 71 sales recorded, down from higher levels in prior periods. Despite softer volume, pricing fundamentals remain stable, with assets trading around $299 per SF at a 7.0% cap rate. While capital markets have become more selective, steady pricing suggests investor demand remains intact, with a continued focus on disciplined underwriting and targeted acquisitions.   By the Numbers Q1 2026 | Source: CoStar Group, Inc. # of Sales: 71 Cap Rate: 7.0% Price Per SF: $299 Vacancy Rate: 18.3% Rent Growth: -0.4% Asking Rent Per SF: $29.73 SF Under Construction: 368K SF Delivered: 120K SF Absorbed: 140K

Image of Andrew Richmond Author

Andrew Richmond

Senior Associate

Image of The Return of Risk-Based Multifamily Valuations Success Story

The Return of Risk-Based Multifamily Valuations

Higher interest rates. Rent caps that limit increases. Rising insurance premiums. These forces aren’t just background noise in today’s multifamily market—they suggest that markets are once again factoring risk back into pricing. Valuations now hinge on the volatility of a property’s underlying cost structure and its flexibility to grow revenue. Before COVID, pricing followed a predictable hierarchy, as cheap f inancing and aggressive rent growth pushed values higher. In turn, cap rate spreads compressed, reducing price dispersion across quality tiers.   Today, that pricing logic has eroded into a renewed focus on risk-based pricing and wider dispersion amongst asset classes and location fundamentals. Cap rates have held firm amid higher expenses, regulatory limits, and more disciplined rent-growth assumptions. CoStar Group Inc.’s forecast projects modest movement with cap rates stabilizing at 6% through 2026, signaling that the valuation reset is being priced into fundamentals rather than a quick return to cheap debt. Cap rates remain tiered by asset quality, with Class A and B assets clustering in the low-to-mid 5% range while Class C properties often price around 6%. Uniform multifamily pricing is over—dispersion is back.   What’s Driving the Reset? The recalibration of valuations between 2023 and 2026 centralizes on the disruption of NOI. Insurance instability, above-yield borrowing costs, and stringent rent control each distinctly strain income performance, widening the bandwidth of operating outcomes investors must price, and pushing cap rate dispersion across asset quality and markets.   Insurance Shock and NOI Margin Compression Insurance costs have become a defining variable. Premiums rose about 28% year-over-year as of early 2024, according to Yardi Matrix’s national multifamily expense data, which showed a cumulative increase of 129% since 2018. Premiums remain structurally elevated relative to pre-pandemic levels, with projections tapering to 3-6% through 2026.   Above-Yield Debt Keeps Pricing Conservative Wider borrowing spreads have translated into more conservative pricing, often requiring greater yield cushion and/or price adjustment, and cap rates have been slow to compress as investors prioritize cash-flow certainty over rate-cut expectations.   Even with continued rate cuts expected by late 2026, pricing remains anchored to property-level risk and NOI sustainability under higher borrowing costs. As a result, negative-leverage deals should continue to fade throughout 2026, with investors demanding durable yield.   Myth: Value-add pricing will normalize once rates fall. Reality: The value-add spread is being driven less by rates and more by execution uncertainty, including higher all-in improvement costs and less reliable rentpremium capture. Pricing Impact: Investors are assigning a larger risk premium to transitional business plans, keeping value-add yields wider and basis expectations tighter.   Rent-Controlled vs. Market-Rate Rents and Revenue Rigidity Rent regulation introduces a structural mismatch between rising operating costs and capped revenue growth. Hard rent ceilings prevent owners from adjusting income to keep pace with inflation, tax increases, or insurance expenses, creating a predictable drag on scalable cash flow. Concurrently, rent-controlled properties typically trade at liquidity and pricing discounts, reflecting the regulatory risk embedded in their operating profiles.   Even modest rent resets allow owners to absorb cost pressures better, giving these properties a measurable pricing premium in today’s environment. The divide between regulated and unregulated income streams has become one of the most persistent valuation gaps between 2023 and 2026.   Revenue flexibility has become a central factor in valuation. Market-rate assets can adjust rents to absorb higher taxes, insurance, and operating costs, preserving NOI stability and attracting tighter yields.   Rent-controlled properties, by contrast, face capped income growth while expenses continue to climb, creating a structural drag on long-term performance. Trepp Research shows that multifamily property values declined roughly 30% in New York City following HSTPA and that rent-controlled assets in Los Angeles and the San Francisco Bay Area trade at discounts to unrestricted peers, with Bay Area tenants staying up to 20% longer—slowing rent resets and revenue growth. Investors price these constraints with wider yields, lower liquidity, and deeper discounts.   In 2026, investors continue to price this constraint through wider yields, lower liquidity, and deeper discounts.   National Valuation Snapshot: Rent-Regulated vs. Market-Rate Source: CoStar Group, Inc. | Q4 2025   Rent-Regulated Cap Rate: 6.4% Sale Price / Unit: $171,927 Positioning: Trades at wider yields and discounted pricing due to regulated rent growth   U.S. Market-Rate Cap Rate: 6.1% Sale Price / Unit: $233,197 Positioning: Higher pricing supported by rent-reset flexibility and deeper liquidity   Rent-regulated multifamily trades at a 30 bps higher cap rate, which translates into 26% lower pricing per unit. The higher required yield compensates for restricted rent growth and limited rent reset flexibility, which constrain NOI upside and make it harder to absorb rising operating costs.   Pricing Dispersion by Fundamentals Uniform pricing spreads have come and gone, and the market has returned to a tiered pricing structure. Investors are particularly meticulous, assigning substantial differences between asset quality, revenue flexibility, and geographic resilience.   Class A vs. Class C Pricing differences between Class A and Class C assets are contingent on the stability of the property type. Class A properties tend to show more predictable NOI, lower operating expense volatility, and modern building systems that reduce unexpected capital needs. That stability supports tighter pricing and more consistent liquidity.   At the opposite end of the spectrum, Class C assets are often characterized by aging infrastructure, longer repair cycles, elevated insurance exposure, and higher turnover rates, all of which introduce greater execution risk and greater performance variability. Investors now incorporate a broader risk premium in pricing.   In 2026, investors continue to price this constraint through wider yields, lower liquidity, and deeper discounts.   Myth: Class A and Class C spreads will tighten back to pandemic levels. Reality: Risk differentiation was temporarily muted between 2022 and 2024, when debt was cheap and aggressive growth assumptions compressed spreads across quality tiers. As that anomaly fades and the hierarchy of asset classes returns, RCA reports that the spread between Class A and Class C now ranges from 150 to 200 basis points, restoring a risk hierarchy more in line with historical norms. Pricing Impact: Spreads are likely to remain wider as long as operating costs and revenue outcomes remain volatile, particularly in Class C, where aging systems, insurance sensitivity, turnover, and capital expenditures introduce greater variability.   National Multifamily Fundamentals By Class Class A Vacancy Rate: 11.1% Asking Rent: $2,165 Effective Rent: $2,131 Absorption Units: 48,024 Price Per Unit: $327,541 Cap Rate: 5.5%   Class B Vacancy Rate: 8.1% Asking Rent: $1,611 Effective Rent: $1,595 Absorption Units: 7,114 Price Per Unit: $194,253 Cap Rate: 6.2%   Class C Vacancy Rate: 6.1% Asking Rent: $1,360 Effective Rent: $1,351 Absorption Units: (7,432) Price Per Unit: $179,022 Cap Rate: 6.6%   Suburban vs. Urban Markets Geographic fundamentals have also reasserted themselves in pricing. Suburban assets generally benefit from stronger household formation, steadier occupancy, and reduced concession pressure, supporting more defensible income profiles and steadier valuations.   Urban assets face different dynamics, including slower rent growth, higher concession packages, elevated turnover, and increased competition from new supply in many core metros. These headwinds support wider yields and more conservative underwriting.   The suburban-urban spread reflects investors’ focus on relative risk and transaction depth. CoStar data shows suburban cap rates modestly above urban levels, indicating investors may still require additional yield for suburban assets even when operating performance is more stable.   Myth: Stabilized assets are insulated from volatility. Reality: Even Class A properties can see NOI pressure when rent growth stalls and operating costs move higher, limiting nearterm upside versus value-add execution. Pricing Impact: Investors increasingly underwrite wider going-in yield cushions for stabilized deals when expense uncertainty rises, widening dispersion versus assets with clearer NOI growth pathways.   The widening gap between asking and effective rents, particularly as quality declines, underscores how concessions and price sensitivity are shaping real revenue outcomes, with weaker absorption in Class C reinforcing downside risk in lower-quality stock.   Houston, The Livewire in Multifamily Valuation This Gulf Coast growth market illustrates how quickly multifamily pricing can separate when operating costs rise and supply accelerates, making it one of the most telling barometers for today’s valuation environment.   Insurance Shock Premiums up 30-70% since 2022 (Source: FannieMae) Older assets are seeing 15-20% Operating Expenses vs. 8% national avg (Source: FannieMae) Class C assets absorb the steepest surcharges due to aging systems and elevated claims history New Supply Wave ~45,000 units projected to deliver from 2024-2026 (Source: CoStar Group, Inc.) Urban cores face the most extended lease-up timelines Concessions up 8–12% YoY across Class A in 2024-2025 (Source: FannieMae) Rent Fundamentals Effective rents flat to negative in several submarkets Renewal spreads compressing Rising vacancy in new deliveries Spread Behavior Apartment Loan Store Class A-Class C differential: 175-225 bps Suburban assets trade 50-100 bps tighter than urban Class C discounts deepest due to OpEx + CapEx exposure Investor Takeaways: Wide dispersion in NOI trajectories, Wider pricing cushions required, and Suburban stability priced at a premium   Even with near-term pressure from supply and insurance-driven operating expenses, Houston’s long-term growth outlook remains intact. Population and job gains continue to expand the renter base, supporting demand as the current delivery wave works through lease-up.   The New Multifamily Pricing Rulebook 1. Location Is About Variability, Not Glamour Suburban assets win because occupancy and concessions fluctuate less, not because they’re “hot” Urban assets face wider valuation ranges due to supply, turnover, and concession cycles 2. Cap Rate Floors Are Now Risk-Tiered Class A: stability benchmark Class B: execute and churn risk premium Class C: greater OpEx variability, CapEx burden, and turnover risk result in the widest cap rate levels 3. Stability Premiums Will Dominate Cap rate compression will be slow and uneven, as pricing is driven by operational risk, rather than macro relief The Class A/C spread remains structurally wide as aging stock absorbs higher insurance, CapEx, and turnover risk   Pricing the Durable Multifamily pricing has shifted toward what can actually be defended at the property level. In an environment defined by cost pressure and uneven demand, valuations reward assets that keep income steady and expenses predictable, and penalize those with wider operating variance. Reading the market now requires focusing less on broad narratives and more on the mechanics that determine whether NOI holds or erodes.   Looking ahead, the reset is likely to remain selective and spread-driven. Properties with flexible revenue, resilient systems, and stable tenant behavior will continue to command a clear pricing premium, while assets with heavier operating drift should face persistent valuation pressure and wider yields. Success in this cycle comes from aligning strategy with what is durable, measurable, and repeatable as the market continues to reprice risk.

Image of Daniel Withers Author

Daniel Withers

Executive Vice President & Senior Director

Image of The Rise of Small-Bay Industrial Success Story

The Rise of Small-Bay Industrial

The industrial sector has seen a significant change following the post-pandemic surge, which resulted in an oversupply of large-scale distribution centers that are 200,000 square feet or greater. Developers responded to the e-commerce boom and low interest rates, and added a record-breaking 1.8 billion square feet of industrial supply across the U.S. since 2020. The new additions outpaced demand as the pandemic slowed down, which led to climbing vacancy rates in the big-box segment.     As the market struggled to absorb this massive influx of large product, developers and investors shifted their focus on small- to mid-sized industrial properties, specifically those ranging from 5,000 to 50,000 square feet. This smaller-scale, or “small-bay,” product remains incredibly tight, with a national vacancy rate near historical lows around 3% to 4%, demonstrating its resilience and importance to last-mile logistics, small businesses, and trade-focused users. The shift highlights a key trend in the evolving industrial sector. While large warehouse development slows, with a vacancy rate around 6%, the demand for smaller, flexible facilities is driving a building boom that reflects the diversity of activity across industrial.   National Small-Bay Trends A variety of tenants are seeking properties between 5,000 to 50,000 square feet. The demand represents a move away from traditional heavy manufacturing toward specialized, knowledge-based services and high-tech operators. This user base includes local trade businesses—such as plumbers, electricians, and HVAC contractors—and small distributors focused on last-mile logistics who seek infill locations closer to their residential customer base.     Additionally, these small- to mid-sized spaces are essential for the growth of modern tech firms. Startups in robotics, drone technology, and specialized R&D require flexible, functional space for prototyping, light assembly, and system testing without the massive footprint of a traditional factory. This newer user base often prefers shorter lease terms than the 10- to 15-year commitments of large distribution centers, allowing for the agility to scale operations quickly with buildouts as their technology matures.     Across the country, the Sunbelt states, as well as markets with high population growth and limited supply, are experiencing the most acute demand and lowest availability. While urban centers like Los Angeles and New York’s outer boroughs remain tight, high-growth metros across the country, including Phoenix’s East Valley, Houston, Atlanta, and Central Florida, are seeing particularly low vacancy rates for this product type. The national availability for industrial spaces under 50,000 square feet is very tight at roughly 3.4%, which is well below big-box levels.   Competition and Constrained Supply The structural scarcity and increased demand for industrial spaces under 50,000 square feet are hindered by construction costs. While overall industrial construction prices have stabilized from their pandemic peaks, the cost per square foot for smaller, multi-tenant industrial projects is higher than for large big-box distribution centers. Small industrial properties recorded an average sales price of $142 per square foot, increasing by 17% over the previous year. In contrast, large industrial projects averaged around $75 per square foot, a lower level that dropped by 4.2% in one year.     This disparity is driven by factors like more extensive site work, complex utility infrastructure, a greater number of individual tenant build-outs, and increased costs for specialized labor. The expense of small-bay construction, coupled with high land costs in infill locations, creates significant barriers to entry for developers, limiting new supply and pushing a variety of highly-qualified tenants into further competition for the existing, limited inventory.   San Francisco: Top Metro for Smaller Footprints The San Francisco Bay Area is a prime example of the high demand and scarcity driving the small-bay industrial market’s outperformance. The Bay Area is a prominent metro for its land limitations and consistent demand from high-value, specialized companies. These factors create an environment where the price per square foot and rental rates for the sub-50,000-square-foot segment have demonstrated greater stability and often faster growth than large-scale facilities, which have seen more volatility due to oversupply in other national markets. The essential need for local logistics, high-tech R&D support, and vital trade services means tenants are willing to pay a premium to secure space close to the metro’s talent and consumer base.     Next-generation tenants are increasingly fueling this demand. While traditional logistics remain active, the region has seen an influx of AI and robotics firms securing smaller footprints for computer power and flex lab setups, often displacing traditional tenants. One example is the metro’s Peninsula submarket. Here, land is the most limited because it is home to several R&D, life sciences, and specialized tech operators, and the area often outpaces Silicon Valley in conversion activity. These users require older industrial stock that can be repurposed to meet high electrical power and specialized utility needs.     Meanwhile, the Oakland/East Bay submarket provides a lower-cost option. Fueled by activity at the Port of Oakland and last-mile distribution requirements, small-bay facilities here are essential for fabrication, local logistics, and distribution that serve other locations across the metro. Further south, San Jose/Silicon Valley is seeing increased demand driven by advanced R&D and manufacturing support services, with data center growth also adding to these expansions. While new additions here are consuming significant industrial land for large, power-intensive facilities, the demand also creates a large domain of support and technical services that rely on flexible, smaller industrial spaces.   Price per SF Rises Since Pandemic Metrowide, But Has Since Stabilized *up to 50,000 SF | Source: CoStar Group, Inc.   A Foundation for the Future Economy The small-bay segment demonstrates the essential, high demand backbone of modern industrial. Unlike the large-format sector, which grappled with post-pandemic oversupply, the small-bay market is characterized by essential demand outpacing scarce supply. With a variety of tenants, from specialized R&D firms and high-tech startups to local contractors and last-mile logistics providers, their operations require proximity to urban centers.   While new, Class A small-bay facilities command premium rents, the competition is increasingly driving smaller businesses to seek more affordable Class B and C industrial properties. This flight to quality underscores a core structural issue—the limited supply of small-bay facilities.   Developers are beginning to explore solutions, like multi-story industrial construction in land-constrained urban markets. While this model is effective for maximizing floor space on a small footprint, its high construction cost means it can only deliver high-end, Class A product, which does not meet demand. The gap between this new, high-cost supply and the consistent need for affordable flex and Class B/C space suggests that the small-bay segment will remain the most increasingly sought-after industrial asset for the foreseeable future.

Image of Belall Ahmed Author

Belall Ahmed

Senior Associate

Image of Texas Retail Market Report | Recap & Future Expectations Success Story

Texas Retail Market Report | Recap & Future Expectations

The Texas retail market continues to serve as a top location for resilience and growth in 2026. Driven by robust inward migration and a diverse corporate sector, the state’s major metros are successfully navigating the headwinds of high interest rates and national tenant shifts. While Austin maintains its status as the occupancy leader and Houston enters a strategic recovery, Dallas-Fort Worth stands out for its development pipeline. With construction levels reaching decade-highs and a clear shift toward experiential, grocery-anchored suburban hubs, the Texas retail landscape is evolving.   By the Numbers | Q4 2025 CoStar Group, Inc. Dallas-Fort Worth Sales Volume: $84.1M Price Per SF: $276 Cap Rate: 6.7% Vacancy Rate: 4.9% Rent Growth: 3.4% Asking Rent Per SF: $224.98 Under Construction: 7.8M SF Delivered: 595K SF Absorbed: 791K SF   Austin Sales Volume: $62.6M Price Per SF: $340 Cap Rate: 6.3% Vacancy Rate: 3.1% Rent Growth: 2.6% Asking Rent Per SF: $31.64 Under Construction: 2.8M SF Delivered: 545K SF Absorbed: 383K SF   Houston Sales Volume: $368M Price Per SF: $248 Cap Rate: 7.3% Vacancy Rate: 5.3% Rent Growth: 2.1% Asking Rent Per SF: $24.59 Under Construction: 3.4M SF Delivered: 537K SF Absorbed: 556K SF   Dallas Leads Nation in Retail Growth Across Dallas-Fort Worth, retail fundamentals continue to show strong resilience and balanced performance. The metro has maintained positive tenant demand for 20 consecutive quarters, despite navigating headwinds from national tenant bankruptcies. Dallas-Fort Worth is currently a national leader in retail construction, with nearly twice the new supply as Houston. While vacancy rates are projected to reach 5% in the first half of 2026 due to new deliveries, demand remains robust across the metro.   North DFW Surge in Demand Investor and developer interest has increasingly focused on the high-growth northern areas of the metro. Denton and Collin Counties account for roughly 65% of all current construction projects. Submarkets like Allen, McKinney, Frisco, and Prosper are primary targets for capital, due to rapid population growth and high household incomes. Specifically, Northern Collin County has seen the time to lease fall to historic lows of approximately five months, driven by a lack of new developments in established trade areas.   The market’s expansion follows opportunities in outlying areas, where major grocery-anchored developments aid further strip mall and traditional shopping center construction. In areas like Collin County, the premium on land has pushed starting rents around $40 to $45 per square foot.   Metro Reaches Record-Breaking Construction Levels DFW is experiencing an ongoing supply wave, reaching 7 million square feet underway at the end of 2025. This is one of the highest development rates recorded for the metro in 10 years. In 2025, the market completed 18% of all net retail deliveries in the country. Despite this surge, supply-side risk is limited as approximately 80% of the retail space currently under construction is already pre-leased.   Mixed-use projects are also driving significant activity. In Collin County, major developments like The Farm in Allen and Fields West in Frisco are creating new retail and residential hubs that feature experiential retailers and unique luxury offerings.   Austin Achieves Robust Retail Activity Across the Austin metro, retail fundamentals are strong, backed by high occupancy, disciplined new development, and constant population growth. According to Matthews™ First Vice President and Director Andrew Ivankovich, the strong transaction velocity seen at the end of 2025 will continue through 2026. “The market experienced such a frenzy from 2019 to 2022 that it made it challenging for deals to pencil in the few years that followed,” he said. “Sellers’ expectations did not change and high interest rates prevented buyers from acting. Today, both sides have improved and we expect it to be reflected in the year-end velocity report.” Shift to the Suburbs Ivankovich added that retail capital has begun to exit Austin’s CBD and is entering suburban markets. In particular, Hays County and Georgetown accounted for an increased amount of the metro’s deals. Private buyers are attracted to Hays County, with the submarket noting a total $21 million in sales for 2025. Meanwhile, Georgetown recorded a rise in deals for newly-built properties and noted a total $51.5 million for its 2025 sales volume. Both submarkets will be crucial to track moving forward given their constant population growth, as well as Round Rock and Cedar Park.   In 2025, Austin’s retail under construction level saw a 38% year-over-year increase, reaching 2.1 million square feet. The metro’s suburbs accounted for more than 96% of all completions last year. Manor is one suburb that stands out from the pack as its inventory grew by 50% throughout the year. The majority of its growth is attributed to the addition of Manor Crossing, a 425,000-square-foot shopping center that was almost fully pre-leased by its completion date.   This year, Cedar Park is the next Austin suburb to note an influx of deliveries. The suburb accounts for 33% of ongoing construction, with Cedar View as the largest development. The new project is a mixed-use site that will feature a hotel, a Scheels sporting goods store, and NFM as its anchor.   Houston is Set to Recover from 2025 Performance Throughout 2025, Houston’s fundamental activity dropped to historic lows. Its total absorption level for 2025 was 2 million square feet, a decrease from the 2024 absorption rate of 2.5 million square feet. Despite this trend, Houston’s sales volume jumped from 2024 and totaled $1 billion by year-end 2025. Josh Longoria, Senior Associate at Matthews™, expects this activity to continue as the federal funds rate slows down. “As we head into the second month of the year, the federal funds rate has been stable and it seems like there will be no more rate cuts until the new Fed chair is elected,” Longoria said. “I think this will lead to more stability in the market and buyers having more clear expectations of where rates will be, and therefore I think transaction velocity will pick back up.”   Tenants Thriving Across Houston 7 Brew and Crunch Fitness are currently two of the largest players in the metro. Crunch Fitness is absorbing sites left by big-box retailers, while 7 Brew is taking up pad sites around 500 to 700 square feet.   Texas is a major market for Crunch Fitness, with a strong presence in the Houston submarkets of Kirkwood, League City, and Humble. Crunch Fitness is a preferred tenant for landlords with vacancies over 35,000 square feet. In 2025, the tenant reached 3 million gym memberships. Specifically in Houston, their locations boast fully booked exercise classes, which signals its robust consumer demand. Crunch Fitness’ growing visitations display its positive activity and add to its strong tenant potential.   7 Brew is one of the fastest-growing coffee chains across the country, doubling its national footprint by the end of 2025. In Houston, its expansion is prominent in outer submarkets, with its most recent and upcoming locations in Conroe, Tomball, Spring, Livingston, and Cleveland. With more openings planned across the metro, 7 Brew will maintain its top performance levels as its format allows for easy store placement and a shorter timeframe for opening than a traditional buildout.   Top Trends to Watch Moving ahead, Longoria advises landlords to pay attention to their tenants and their sales trends. “I have heard from multiple landlords that the restaurants and beverage concepts are doing as well as they have previously,” he said. “High-end restaurants are not getting as much traffic, which is helping the lower-priced options.”   Longoria added that he expects construction activity to pick back up as it has been slow throughout the past few years. “Development is going to come back into full effect as the cost breakdown to build new construction did not make sense and the spread was too thin,” Longoria stated. Specifically, Longoria said that new developments are likely to grow in the 610 Loop. One of the largest additions inside the 610 Loop is Midway’s East River project. The facility is located on the former KBR industrial site east of Downtown, and will add more than 1 million square feet to the area.

Image of Andrew Ivankovich Author

Andrew Ivankovich

First Vice President & Director

Image of Q&A Patrick Graham | Houston Market Leader Success Story

Q&A Patrick Graham | Houston Market Leader

What It Takes to Win Long-Term in Brokerage Q: Working as a broker, developer, contractor, and investor with over 20 years of experience, you have truly become a chameleon of commercial real estate. What advice do you have for professionals currently navigating this cycle of the real estate market? A: When I first started in commercial real estate, no one told me to specialize. I pursued any deal I could find, and I worked on it. Financially, I did well, but in hindsight, the lack of specialization set me back.   Throughout my career, I closed retail, industrial, office, and land deals, and I worked every side of transactions—buyer, tenant, landlord, and seller. I also did construction project management and development.   My advice to professionals today is: don’t be a chameleon.   Don’t try to be a broker, developer, contractor, and investor all at once. Pick a lane, and be great at one thing. Yes, this is me giving “do as I say, not as I did” advice, but it comes from personal experience. Do not be a generalist, be a specialist, in whatever it is you do. I regret nothing because my generalist background allows me to mentor anyone on any product type, but I do not recommend this approach.   Q: Did you plan to build such a diverse commercial real estate career early on, or did it play out organically? A: I spent a decade practicing as a generalist in commercial real estate before realizing something had to change. I looked back at my transaction history and realized I had built broad knowledge across multiple service lines. It was valuable, sure, but it wasn’t as scalable or monetizable as the work my specialized peers were doing.   So I revisited my transaction history deal by deal, paying attention to what I actually enjoyed and what I didn’t, and whether the return on my time matched the effort required.   That’s how I found my niche—assisting multi-unit retail operators who wanted to own their real estate. I represented them as buyers so they could lease the real estate back to their operating business. I still did tenant representation because it was necessary for those clients, but the owner-occupied side became my primary focus.   I found this work more rewarding and mentally stimulating than anything I’d done in the previous decade. It was challenging, but that’s what pushed me to excel and what allowed me to deliver tremendous value to my clients. Once I narrowed my focus, that specialization became what I was known for—and that’s when the phone started ringing. I tell agents, sometimes you pick your specialization, but sometimes your specialization picks you. I think my specialization in retail buyer and tenant site selection picked me.   Q: Looking back on your full commercial real estate journey, what is one deal, decision, or turning point that still shapes how you think and operate today? A: Early in my career, a colleague handed me a listing for a small, irregular tract of land. Had I known any better, I probably would have passed on it, but I was hungry for something to call people about, so I jumped in.   One of my first cold calls—literally in my first week of brokerage—was to the owner of the light auto repair shop that sat right in the way of a clean assemblage. I called to see if he’d consider selling, which would allow me to assemble the tracts and make them worth more together than apart.   He wasn’t interested in selling. But I didn’t let the lead go cold. I focused on becoming a resource for him.   Over the next few months, I provided him with valuable insights on how repositioning his shops could better serve the market if he sold. Eventually, he agreed to sell, but only if I could find him a place to relocate his shop.   That initial cold call, to someone who had zero interest in selling, blossomed into a 20-year relationship. He owns over 60 locations across Texas, and since then, I’ve represented that family on hundreds of transactions that have generated millions in fees. But the real equity is in the trust and the personal bond we’ve built. Today, we still do business together, but we are even better friends. We know each other’s spouses and kids. When I visit San Antonio, I stay at their house.   That’s what makes being a commercial real estate agent the greatest business in the world. It’s a lifelong relationship you can build with your client.   Q: Can you share what your favorite transaction was, and why? A: That irregular tract of land wasn’t just my first listing—it was the ultimate masterclass.   Because the tract was so poorly shaped, I had to engineer a solution by bringing the neighbors into the fold. Once I convinced the auto shop owner that relocating would put him in a better position to grow, I went to work strengthening the assemblage. I approached the landowner on the other side of him, and she agreed to list her property as well. Suddenly, what started as an awkward, low-frontage listing turned into a much more viable site with real upside. Ironically, the parcel never actually traded. But that small piece of land led to the best client relationship of my career and ultimately spun off hundreds of transactions over the next two decades. It was a listing most agents would’ve passed on, and it ended up shaping how I’ve approached brokerage ever since.   Q: You stepped away from your own companies to focus on your passion for guiding the next generation of brokers. What made Matthews the right fit for this next chapter in your career? A: I’d been a partner at a large international brokerage firm before, so I understood the value of having a strong platform behind you—as an agent, a principal, and an office manager. I’ve also founded and operated my own brokerage alongside several other businesses.   Over time, I decided I wanted to build something special around one business, and the one I was most passionate about was brokerage. I started winding down my other ventures while writing my training materials and building the back-office platform I knew I’d need to effectively scale the business.   That’s when I found Matthews™.   They were executing a business model that was incredibly similar to what I had intended, and their training philosophy was almost verbatim to the materials I was writing for my own firm. At the time, Matthews™ hadn’t entered the Houston market, so I reached out to see what their plans were.   The alignment was instant. I understood the value of a large platform, and knew I could accelerate what I wanted to accomplish by joining Matthews™ and opening an office in a top-five market. It was a no-brainer.   I wanted to make a difference in helping young people start in brokerage and become great agents, and Matthews provided the engine to help me achieve that purpose.   Q: What do you consider the most important qualities of a successful agent and how can leaders like yourself help develop those traits? A: The agents I bring on in Houston embody the same core qualities: competitiveness, intelligence, conscientiousness, and self-awareness.   Competition is a good thing. It makes us better and pushes us to greater heights. Successful agents do not want to win, they need to win. There is an internal drive that pushes them to work harder than their opponent. They study, practice, and hustle to achieve their purpose. They grow comfortable being uncomfortable and sacrifice to win.   Commercial real estate is a problem-solving business that requires intellect, and speed of comprehension is a competitive advantage. The more you can efficiently learn and digest the complexities of your specialization, the faster you will achieve success as an agent. This isn’t about being a genius. It’s about having the intellectual capacity to do the work and adapt in real-time.   Conscientiousness is about being aware of how your actions affect other people. Conscientious people care about how they help others. It’s important for agents to listen, so they can understand and deliver high-quality service to their clients. It’s also essential for long-term success in any office. Conscientious agents elevate the culture, communicate well, and make everyone around them better.   Another critical component is being self-aware. In this industry, you will face setbacks, but if you blame external factors for your lack of success rather than taking personal responsibility, you will not make it far.   If I hire competitive, intelligent, conscientious, and self-aware agents, we’ll do amazing things. I recruit, hire, train, coach, and develop these traits in my agents every day.   Q: How do you define success, and how has that definition evolved over the years? A: The value of our existence or our measurement of success must never be based on a number. You must have a purpose that drives you that transcends monetary success. If the value of your existence is based on how much money you make, you will live a shallow life and struggle navigating the fluctuations of our industry.   If, instead, the value of your existence is defined by how well you accomplish a meaningful purpose—and you pursue that purpose with diligence, determination, persistence, excellence, teamwork, and attitude—you will enjoy great success and live a life of deep personal meaning.   I define success not by numerical measurements but by how well I live up to my purpose. My purpose is to follow God’s will for my life and inspire greatness in commercial real estate professionals. The measure by which I meet the standard set by that purpose every day is the only measure of success that matters to me. Q: Houston is in a generational reset, bringing a fresh perspective and new capital to the market. What are you most excited about, and why? A: Houston has one of the most ethnically diverse populations in the country, bringing immense value to our community. As a global hub for multiple industries, our leaders are driving significant new development both here and across the State of Texas.

Image of Patrick Graham Author

Patrick Graham

Market Leader

Image of Houston, TX Multifamily Market Report Q4 2025 Success Story

Houston, TX Multifamily Market Report Q4 2025

Houston’s multifamily fundamentals remained under pressure in Q4 2025, with vacancy reaching a record-high 12.4% and net absorption slowing sharply. Quarterly absorption turned negative in late 2025 for the first time in three years, while annual demand ran roughly 30% below pre-pandemic norms. Asking rents declined 0.9% year-over-year, marking a sustained period of negative rent growth following the first contraction in more than a decade earlier in 2025. Operators have largely prioritized occupancy over rent growth, relying heavily on concessions to compete with new lease-ups. Luxury properties have outperformed on an absorption basis, supported by reduced development starts and long-term affordability advantages versus homeownership, though even this segment has seen rent cuts. By contrast, workforce and mid-tier assets have experienced net move-outs, driven by economic stress and affordability pressures. Suburban submarkets in the northwest and southwest regions of the market continue to account for the majority of positive absorption, while many urban neighborhoods report elevated resident turnover.   Key Findings Houston’s multifamily market remains oversupplied, with elevated vacancy and negative rent growth persisting as new deliveries continue to outpace demand, delaying a full supply-demand reset. Leasing activity is increasingly bifurcated, with suburban submarkets and luxury assets capturing most absorption while workforce and mid-tier properties face sustained pressure. Investment activity strengthened through late 2025 as pricing stabilized, financing conditions improved, and investors targeted value-add opportunities amid a cooling but resilient economic backdrop.   Houston Multifamily Supply & Demand Dynamics Source: CoStar Group, Inc.   Houston Demographics Source: CoStar Group, Inc. Unemployment Rate: 4.4% Current Population: 7,902,289 Households: 2,870,567 Median Household Income: $83,948   Houston remains one of the nation’s largest and fastest-growing metropolitan areas, supported by long-term population inflows and a relatively affordable cost of living. The metro’s population of approximately 7.9 million has expanded nearly three times faster than the national average over the past decade, driven by domestic migration and international inflows. Employment growth has moderated meaningfully, with job gains slowing from post-pandemic highs, though total employment still exceeds pre-COVID levels by more than 300,000 jobs. Oil and gas remains influential, but continued diversification into healthcare, life sciences, aerospace, and biomedical research provides structural support for long-term housing demand. The Texas Medical Center and the TMC3 project represent a major future employment catalyst, though near-term labor market cooling has dampened renter confidence.   Houston is the fifth most populous metro area in the United States. 2025 | Source: Greater Houston Partnership   Population, Labor Force, & Income Growth Source: CoStar Group, Inc.   Houston Multifamily Construction Construction activity has moderated significantly, despite navigating a sizable wave of recent deliveries. Approximately 1,300 units delivered in late 2025, bringing the total number of deliveries since 2023 to more than 62,000. Roughly 13,000 units remain under construction, marking the smallest active pipeline since 2017 but still sufficient to keep vacancy elevated in the near term. New supply is concentrated in high-density urban submarkets and fast-growing suburban corridors, especially in the northwest and southwest portions of the metro. Looking ahead, the sharp pullback in construction is expected to gradually relieve supply pressure and support rent stabilization in late 2026 or early 2027. However, near-term competition among recently delivered assets will remain intense.   Units Construction Starts Source: CoStar Group, Inc.   Units Under Construction Source: CoStar Group, Inc.   Houston Multifamily Sales Investment activity gained traction through 2025, with sales volume reaching approximately $81.5 million in Q4 as transaction counts climbed to a four-year high. Investor sentiment improved as bid-ask spreads narrowed and debt availability expanded, led by the GSEs alongside growing participation from debt funds, banks, and life companies. Average pricing settled near $150,000 per unit, while cap rates averaged approximately 6.6%, reflecting a more normalized risk environment compared to recent years. Transaction activity has been heavily skewed toward value-add and lower-rated assets, with more than four-fifths of trades involving Class C properties. Private capital continues to anchor the buyer pool, though institutional participation increased meaningfully and approached historical norms. Overall pricing is expected to remain relatively stable in the near term, supported by improving liquidity and long-term confidence in Houston’s demographic and economic trajectory.   Houston Multifamily Sales Volume Source: CoStar Group, Inc.   By the Numbers Q4 2025 | Source: CoStar Group, Inc. Sales Volume: $81.5M Price Per Unit: $150K Cap Rate: 6.6% Vacancy Rate: 12.4% Rent Growth: (0.9%) Asking Rent Per Unit: $1.4K Units Under Construction: 13K Units Delivered: 1.3K Units Absorbed: 233

Image of Luke Matthews Author

Luke Matthews

Associate

Image of Houston, TX Medical Office Market Report Q4 2025 Success Story

Houston, TX Medical Office Market Report Q4 2025

The Houston medical office market closed Q4 2025 with steady but measured performance, supported by solid leasing activity amid elevated vacancy. A total 100 medical offices sold this quarter, with assets trading at an average cap rate of 7.5% and $187 per square foot, reflecting cautious but ongoing investor interest. Leasing momentum remained positive as 508,000 square feet leased outpaced 329,000 square feet delivered. Vacancy was elevated at 15.2%, highlighting continued availability, particularly among older assets. Rent growth was modest but positive, with asking rents averaging $30.20 per square foot following 1.5% year-over-year growth. Overall, the market demonstrated resilience, though moderate rent gains and higher vacancy suggest conditions remain in a rebalancing phase going forward.   Key Findings Market Vacancy and Demand: Houston’s medical office vacancy remained elevated at 15.2%, though steady leasing activity helped prevent further expansion. With 508,000 square feet leased outpacing new deliveries, tenant demand showed resilience, particularly in well-located and higher-quality properties. Rent Trends and Pricing: Average asking rents reached $30.20 per square foot, reflecting 1.5% year-over-year growth. Rent gains remained modest as landlords balanced pricing power with competitive concessions, signaling a stable but cautious rental environment. Development and Investment Activity: Approximately 1.6 million square feet of medical office space remained under construction, as developers moderated new starts. The metro noted a total 100 sales this quarter, with pricing holding near $187 per square foot and cap rates averaging 7.5%.   Houston Demographics Source: CoStar Group, Inc. Unemployment Rate: 4.4% Households: 2,869,552 Current Population: 7,900,549 Median Household Income: $83,933   Rents Medical office rents in Houston trended modestly upward over the past year, reflecting gradual improvement in leasing fundamentals. Average asking rents increased to $30.20 per square foot, up from the $28 range earlier in the period. The upward movement suggests landlords are achieving selective rent growth, particularly in higher-quality assets and well-established medical submarkets. While overall rent growth remains moderate, the consistency of increases indicates stable tenant demand and limited downward pressure on pricing, even as vacancy remains elevated.   Market Asking Rent Per SF Source: CoStar Group, Inc.   Vacancy Vacancy across Houston remained elevated but showed signs of gradual improvement over the past year. The vacancy rate trended downward from the mid-15% range earlier in the period, ending at 15.2%. Tightening periods were driven by steady leasing activity that helped offset new supply, though gains were tempered by ongoing deliveries and competitive space availability. While vacancy remains above historical norms, the overall downward trend suggests progress toward stabilization. Continued absorption will be key to sustaining vacancy compression in the near term.   Vacancy Rate Source: CoStar Group, Inc.   Construction Houston medical office construction remained active but uneven over the past year, reflecting shifting developer sentiment. Quarterly construction starts fluctuated significantly, ranging from approximately 55,000 square feet to nearly 470,000 square feet. Total space under construction peaked near 2.0 million square feet before trending lower, ending the period at approximately 1.6 million square feet underway. The recent moderation in active construction suggests developers are exercising greater caution in response to elevated vacancy and modest rent growth.   SF Under Construction Source: CoStar Group, Inc.   Sales Deal activity in the Houston medical office market moderated in Q4 2025, with a total 100 sales, down from several stronger quarters earlier in the year. The quarterly fluctuations in sales volume underscore a market characterized by selective investor engagement, with buyers prioritizing stabilized assets and clear pricing opportunities amid elevated vacancy and modest rent growth. Despite the slowdown, pricing metrics remained relatively stable, suggesting underlying confidence in long-term medical office fundamentals. Notably, one of the most significant transactions of the quarter occurred at 1800 Augusta Drive, which sold for $6.7 million, highlighting continued activity among smaller-scale medical office assets.   By the Numbers Q4 2025 | Source: CoStar Group, Inc. # of Sales: 100 Cap Rate: 7.5% Price Per SF: $187 Vacancy Rate: 15.2% Rent Growth: 1.5% Asking Rent Per SF: $30.20 SF Under Construction: 421K SF Delivered: 329K SF Absorbed: 508K  

Image of Andrew Richmond Author

Andrew Richmond

Senior Associate

Image of Houston, TX Industrial Market Report Q4 2025 Success Story

Houston, TX Industrial Market Report Q4 2025

Houston’s industrial market moderated further in Q4 2025 as new speculative supply continued to weigh on fundamentals, pushing vacancy to 7.2%. Net absorption totaled roughly 2.6 million SF over the past year, down sharply from the post-pandemic peak. In addition, recent deliveries, 3.4 million SF, have outpaced demand, particularly among large, newly built logistics facilities. Even so, rents remain a bright spot: asking rates are up 4.0% year over year, supported by solid leasing activity and limited supply in infill and small-bay segments where vacancies remain well below the market average.   However, rising concessions, longer deal cycles, and softer big-box pricing signal a gradual shift toward a more balanced, increasingly tenant-friendly environment heading into 2026.   Key Findings Tenant decision-making slowed in Q4 2025 amid tariff uncertainty and economic headwinds, with larger spaces taking longer to lease, as properties 100,000 SF or larger average 7.5 months on market. The vacancy rate increased for the third consecutive quarter in Q4 2025, reaching roughly 7.1%–7.3%, as absorption slowed to 2.6 million SF and new speculative supply continued to enter the market. Market rents were up 4.0% year over year in Q4 2025, supported by gains earlier in the year and strong renewal spreads, though quarterly growth slowed to roughly 1.0% as rising supply and elevated vacancy shifted leverage modestly toward tenants, particularly in large-format space.   Houston Industrial Supply & Demand Dynamics Source: CoStar Group, Inc.   Houston Demographics Source: CoStar Group, Inc. Unemployment Rate: 4.4% Current Population: 7,892,334 Households: 2,865,174 Median Household Income: $83,818   Houston’s economy remains one of the nation’s stronger large-market performers. With a population of roughly 7.9 million, the fifth largest in the U.S., Houston continues to attract residents due to its young, diverse population, relative affordability, pro-business climate, and median household income of about $83,000. While energy remains a cornerstone, the region is steadily diversifying, led by healthcare, life sciences, aerospace, and biomedical research anchored by the Texas Medical Center, where projects like TMC3 are expected to generate tens of thousands of jobs and billions in economic impact.   Port Houston ranks #1 among U.S. seaports for international tonnage with 220.1M metric tons by vessel. 2024 | Source: Greater Houston Partnership   Houston Employment by Sector Q4 2024 | Source: Greater Houston Partnership   Houston Industrial Construction Industrial construction in Houston remained elevated in Q4 2025, bucking national trends as developers continued to build despite tighter financing conditions. With roughly 24.9 million SF under construction, among the largest pipelines in the U.S., only about 25% pre-leased, new supply has added pressure to fundamentals, contributing to a 7.2% vacancy rate. While demand remains healthy at 2.6 million SF of annual net absorption, supply-side risk is concentrated in large, speculative big-box projects, which are taking longer to lease and are expected to drive additional vacancy expansion into 2026.   SF Construction Starts Source: CoStar Group, Inc.   SF Under Construction Source: CoStar Group, Inc.   Houston’s industrial market posted sales volume of $529M in Q4 2025. Source: CoStar Group, Inc.   By the Numbers Q4 2025 | Source: CoStar Group, Inc. Sales Volume: $529M Cap Rate: 7.7% Vacancy Rate: 7.2% Rent Growth: 5.3% Under Construction SF: 24.9M Delivered SF: 3.4M Absorbed SF: 2.6M

Image of Doc Perrier Author

Doc Perrier

First Vice President & Director

Image of The Rising Tide of Hotel Delinquency Success Story

The Rising Tide of Hotel Delinquency

While post-pandemic tourism seemed to promise a robust recovery for the hotel industry, 2025 has emerged as the year of significant financial headwinds, with growing loan delinquencies indicating underlying stress. An analysis of hotel delinquency reveals an increase in loan distress driven by broader macroeconomic pressures, shifting consumer behavior, and a complex capital markets environment. These challenges are disproportionately affecting specific hotel sectors and metropolitan areas, creating a nuanced and uncertain outlook for the industry going forward. The overall CMBS delinquency rate rose through mid-2025, driven partly by lodging loan distress. For instance, Trepp data shows the CMBS delinquency rate climbing to 7.03% in April 2025, the highest since January 2021. While the lodging delinquency rate showed volatility, it contributed to the broader upward trend. The overall outlook for lodging performance in 2025 is modest, with projected Revenue Per Available Room (RevPAR) growth under 1%. Industry forecasts suggest a modest recovery beginning in 2026, assuming improved economic conditions, more certain federal policy, and stabilizing inflation.   Economic Drivers of Delinquency High Interest Rate: The prolonged period of elevated interest rates has made refinancing difficult and more expensive for hotel owners, increasing the risk of maturity defaults. Persistently High Inflation: Elevated inflation has increased operating and ownership expenses for hotels faster than revenue growth, squeezing profit margins. Weakened Economic Growth: A projected slowdown in U.S. GDP growth in 2025 dampens overall consumer and business spending, negatively affecting hotel demand. Slowing Consumer Spending: High inflation and macroeconomic fatigue are impacting consumer behavior, with a noticeable decline in travel intent, especially in certain market segments.   How Capital Markets Environment is Impacting Distress Tightened Lending Standards: Banks and other lenders have become more selective and conservative in underwriting new hotel loans, tightening coverage requirements and reducing leverage. Bank Pullback: Regional and mid-tier banks, a vital source of financing for many hotel owners, have significantly pulled back from commercial real estate lending. Increased Maturity Defaults: The combination of higher interest rates and tight lending has led to an increase in loan maturity defaults, forcing borrowers to seek extensions or face special servicing.   Sector-Specific Distress Facing the most acute wave of refinancing stress since the Global Financial Crisis, the data for Q4 2025 reveals a nationwide swell of loans reaching maturity between late 2025 and early 2026, with an alarming concentration of full-service hotel assets on watchlists or already transferred to special servicers. According to data, roughly 40-45% of full-service loans are flagged as “potentially troubled”, “troubled,” or “transferred to special servicer.” The distress is particularly concentrated in gateway and convention-heavy markets such as: New York City San Francisco Los Angeles Atlanta Miami Boston These are properties that were historically resilient due to strong business and international travel demand but are now struggling under the weight of variable-rate debt, declining RevPAR recovery trajectories, and inflated expense structures (labor, insurance, property tax). Meanwhile, limited-service hotels — though not immune — show greater stability, with distress levels closer to 15–20%, mostly among older assets in secondary or tertiary markets.   Sector Breakdown Economy and Extended-Stay Segments: Recent trends show rising strain in the economy and extended-stay categories, particularly concerning the latter. While initially resilient during the pandemic, extended-stay delinquency rates surged in 2024 and 2025, possibly due to oversupply in some areas and macroeconomic pressure on budget-conscious consumers. Full-Service Properties: This segment has seen a slower recovery than limited-service hotels as, as of July 2025, remains well above pre-pandemic delinquency levels. Their reliance on business, group, and international travel makes them vulnerable to shifts in these demand channels. Luxury and Upscale Segments: These properties generally fare better, as high-income travelers have maintained their spending, allowing these hotels to maintain stronger performance. However, not all luxury and upscale hotels have scrapped by. Some high-profiles assets have been flagged as distressed, with nearly 60% having variable-rate loans, often structured as fully interest only, these include: The Ritz-Carlton Kapalua Embassy Suites Denver Downtown Ritz-Carlton San Francisco Renaissance Atlanta Midtown Marriott Charlotte City Center The floating-rate structure has compounded stress as benchmark rates surged, doubling interest costs in under 24 months. The Maturity Wall Effect The data shows over 70% of loans maturing in Q4 2025, corresponding with refinancing vintages from 2015 and 2020. These loans originated during eras of either: historically low interest rates (2015–2020), or COVID-era forbearance extensions. As these mature into a 2025 environment with rates 300–400 bps higher, debt service coverage ratios are collapsing — especially for hotels with variable-rate or interest-only structures.                                                                 Geographic Concentration of Risk Oversupply and Market-Specific Factors: Banks and other lenders have become more selective and conservative in underwriting new hotel loans, tightening coverage requirements and reducing leverage. Reliance on Specific Travel Types: Metro areas heavily dependent on business or international travel may experience heightened risk, while leisure-driven or drive-to markets may be more insulated. For example, a decline in inbound international travel impacted major U.S. markets in 2025. Political or Economic Events: Localized events, such as the deployment of National Guard troops or FEMA have also been noted as affecting hotel performance and occupancy.   West Distress Concentrated Maturity Risk: Nearly half the regional hotel debt will mature by 2027, the peak point of refinancing risk due to higher interest rates and slower RevPAR recovery. Limited-Service Weakness: While full-service hotels capture headlines, the distress here is deeply structural and operational, concentrated among smaller franchised assets in suburban markets that lack pricing power and have absorbed operating cost inflation. California’s Market Divide: Northern California’s tech-linked metros (San Jose, East Bay, Sacramento) show more stress than Southern California, where leisure demand remains resilient. Institutional Fallout ahead: Given the clustering around major flagged portfolios (Larkspur and Marriott-affiliated loans), expect loan sales, recapitalizations, or CMBS transfers through 2026-2027.                                                                                                            Southwest Distress Texas: The Epicenter of Refinancing Risk: With over 70% of Southwest exposure, Texas is the region’s stress point—especially Dallas, Houston, and Austin, where high concentrations of CMBS debt originated during the 2016-2018 boom now approach maturity. Limited-Service Saturation and Margins: The distress curve is driven by margin compression rather than occupancy collapse. Labor and insurance costs are eroding NOI for franchised, limited-service hotels. Maturity Wall Alignment with National Pattern: The Juen 2027 concentration mirrors the West’s pattern, signaling that across both regions, the 2027-2029 refinancing window will likely trigger a broader restructuring cycle. Brand-Level Vulnerability: Brands like Travelodge, Hampton, and Holiday Inn Express dominate distress counts, signaling systemic exposure for select-service operations tied to midscale demand                                                                                                                                                                                                                        Northeast Distress Urban/Suburban-Weighted: Northeast distress is anchored by legacy business travel metros and secondary cities with aging hotel infrastructure. Structural Loan Risk—Mezzanine Exposure: At 22% mezzanine loans, the region shows one of the highest mezz debt shares of all regions, a key indicator of capital stack complexity and limited refinance flexibility. Cross-Brand Refinancing Risk: Even upper-midscale brands (Residence Inn, Courtyard, Hilton Garden Inn) are facing refinancing pressure. This suggests the issue is macro-financial (interest rate and NOI compression) rather than localized underperformance. Maturity Wall Alignment with National Trend: The June 2027 spike aligns with the cross-regional pattern, confirming that most of the U.S. hospitality sector will hit a refinancing wall in mid-2027.                                                                       Midwest Distress Twin Maturity Cliffs: The Midwest will face two separate stress waves—a 2027 maturity surge driven by 2017 loan vintages, and a 2029 wave tied to later-cycle CMBS issuance. This will extend refinancing risk deeper into the decade. Limited-Service Saturation and Margin Pressure: High exposure to limited-service hotels (89%) creates systemic vulnerability. Persistent operating cost inflation (labor, utilities, insurance) continues to erode debt coverage, especially for older franchised assets. Diffuse Distress, Localized Pain: The Midwest’s pattern is broad and diffused, reflecting a slower bleed rather than a single collapse. Tertiary metros in Ohio and Kansas will face the most acute refinancing hurdles due to limited lender appetite. Economy and Extended-Stay Weakness: Both extremes of the market—low-end economy chains and older extended-stay brands—are struggling. This reflects a bifurcated recovery, limited ADR growth for economy properties and prolonged business travel softness for long-stay assets                                                                                                                                                                                                                                                       Southeast Distress Early Maturity Wall: The Southeast faces an earlier maturity surge in mid-2026, setting it up as the first regional test case for hotel refinancing outcomes. Florida, Georgia, and the Carolinas will likely see repricing events in early 2026 as institutional owners seek discounted refinances or sell debt at par losses. Diverse Market Exposure, Concentrated Risk: Distress is concentrated in Sunbelt metros (Atlanta, Charlotte, Raleigh, Nashville, and New Orleans). Many high-growth markets that overbuilt between 2015-2019. Furthermore, the highest exposure sits in suburban corridors and interstate-linked nodes (outside primary business districts) leaving them more exposure to cap rate expansion. Brand-level Stress Across Chain Scales: Distress extends from budget (WoodSpring, La Quinta) to upscale (Embassy Suites, Courtyard) — revealing that rate pressure and higher debt costs are sector-wide issues, not confined to lower-tier operators. Refinancing Complexity Rising: The 14% mezzanine share signals layered capital stacks, making workouts more complex. Many mezz positions likely originated during the 2020–2021 recovery wave, meaning borrowers now face constrained equity and debt yields.                                                                                                            Outlook The overlap between maturity walls and rate resets implies distress will intensify into Q4 2025–Q1 2026. For many borrowers, refinance proceeds won’t cover existing debt balances, forcing capital calls, equity dilution, or hand-backs to lenders. As hotel owners navigate this environment, they will seek loan extensions, focus on operational efficiencies, and in some cases, target value-add properties that can be repositioned. Vulnerability to Continued Distress Consumer Credit Stress: Growing credit card delinquency rates, particularly among lower-income consumers, pose an ongoing risk to the economy hotel segment. Rising Expenses: Inflationary pressures and a tightening labor market continue to increase operating costs, eating into profit margins and pressuring hoteliers. Capital Expenditures (CapEx) Challenges: With thinner margins, some limited-service properties may defer necessary maintenance and renovations, leading to asset quality deterioration and longer-term risks. The increasing hotel delinquency market is a complex issue driven by high interest rates, inflation, and shifting consumer behavior. The impact is not uniform, with economy and extended-stay properties showing rising distress, while luxury segments remain relatively stable. The ability of individual markets to recover depends on local demand drivers and overall economic health. The delinquency trend highlights the broader stress in the commercial real estate market and is susceptibility to macroeconomic shocks. It underscores the importance of resilient capital structures and agile management strategies. The coming years will test the resilience of many hotel owners as they navigating refinancing hurdles and a more cautious consumer climate.

Image of Mabelle Perez Author

Mabelle Perez

Vice President

Image of Houston, TX Retail Market Report Q3 2025 Success Story

Houston, TX Retail Market Report Q3 2025

Retail leasing activity in Houston remained solid through 2025, driven primarily by demand for newer, higher-quality centers. Properties built within the past five years absorbed over 3 million SF in the past year, supported by tenants like grocery, fitness, quick-service restaurant, and auto-service users. Leasing volume through the first three quarters reached 8.1 million SF, up 10% year-over-year, with strong backfill demand as bankruptcies eased. However, prime space remains limited—half of available inventory was built before 1990, and availability in Uptown/Galleria sits near historic lows at 2%. Rent growth has slowed to 1.5% year-over-year, averaging $24.00/SF, though prime suburban pads exceed $30/SF. Despite the cooling pace, Houston remains a landlord’s market with minimal concessions for top-tier space.   Key Findings Houston’s retail market remains tight, with vacancy at 5.3% and absorption of 876,000 SF driven by strong demand for newer, high-quality space and limited prime availability. Asking rents rose 1.6% year-over-year to $24.30/SF as construction costs and lending constraints kept new supply low, with only 2.7 million SF currently underway. Investment momentum strengthened with $326 million in sales at $246/SF and cap rates stabilizing at 7.3%, reflecting renewed confidence and increased REIT and private buyer activity.   Houston Retail Supply & Demand Dynamics Source: CoStar Group, Inc.   Houston Demographics Source: CoStar Group, Inc. Unemployment Rate: 4.4% Current Population: 7,889,857 Households: 2,889,349 Median Household Income: $81,974   Houston’s economy remains one of the nation’s strongest, with employment still well above pre-pandemic levels despite a slowdown in job growth. The metro’s population of 7.9 million continues to rise, supported by affordability, diversity, and a pro-business climate. Houston is rapidly diversifying into healthcare, life sciences, and aerospace, led by major developments like the TMC3 project, which will add thousands of jobs and billions in economic impact. Median household income slightly exceeds the national average, reflecting strong earning potential and a relatively low cost of living. Houston’s global connectivity—particularly its strong ties to Mexico and Latin America—also supports steady business, trade, and medical tourism growth.   Population, Labor, & Income Growth Source: CoStar Group, Inc.    Houston Retail Construction Retail construction in Houston remains near record lows as high costs and strict lending standards hinder new starts. Most projects require anchor tenants or 30–50% preleasing to move forward. About 2.7 million SF is underway, half the 2015–2019 average, with roughly 75% preleased, limiting new supply impacts. Development is concentrated in fast-growing suburban areas like Montgomery County and Far South Houston, often featuring grocery-anchored or smaller strip centers. Urban redevelopment is gaining traction, highlighted by Midway’s $2.5 billion East River project near Downtown and the 105-acre San Jacinto Marketplace in Baytown. Overall, supply will remain constrained as rising construction costs continue to outpace achievable rents.   SF Construction Starts Source: CoStar Group, Inc.   SF Under Construction Source: CoStar Group, Inc.    Houston Retail Sales Houston’s retail investment market has been highly active in 2025, with transaction volume up nearly 50% year-over-year as buyers and sellers align on pricing. Regional banks remain the most active lenders, while larger banks and insurance companies are gradually returning. Cap rates, which expanded sharply in 2023–2024, have largely stabilized or even compressed, with triple-net properties trading around 5–6% and strip centers in the 7–8% range. Private buyers still dominate, though REITs are reentering, exemplified by Brixmor’s $223 million purchase of LaCenterra at Cinco Ranch. Despite inflation and tariff concerns, limited new construction and strong demand continue to support Houston’s retail market stability.   Houston Retail Sales Volume Source: CoStar Group, Inc.   By the Numbers Source: CoStar Group, Inc. Sales Volume: $326M Price Per SF: $246 Cap Rate: 7.3% Vacancy Rate: 5.3% Rent Growth: 1.6% Asking Rent Per SF: $24.30 Under Construction: 2.7M SF Delivered: 733K SF Absorbed: 876K SF

Image of Houston, TX Industrial Market Report Q3 2025 Success Story

Houston, TX Industrial Market Report Q3 2025

Houston’s industrial market softened slightly in Q3 2025 as vacancies continued their upward trend and rent growth moderated. The overall vacancy rate rose to 7.4%, up from 7.3% in Q2 and 6.4% a year ago, reflecting the continued imbalance between new supply and demand. Compared with the prior quarter, net absorption declined by roughly 12%, while new deliveries increased by nearly 18%, widening the vacancy gap.   Absorption rates remain about 15% below 2017–2019 levels, suggesting it could take several years for the bulk distribution sector to return to balance. Despite this, absorption stayed positive, with 10.9 million SF taken up over the past year. Asking rents averaged $9.33/SF, up 3.2% year-over-year but with minimal quarterly growth of 0.3%, as speculative deliveries gave tenants more leverage. The slower quarter-to-quarter rent movement contrasts with the 0.7% gain seen in Q2, underscoring a cooling trend in pricing momentum.   Key Findings Panelmatic and Inventec signed leases over 500,000 SF near I-45 and I-10, and in September, Eli Lilly revealed plans for a $6.5 billion manufacturing facility in Generation Park—the largest in the U.S. Vacancy reached 7.4% as new supply entered the market and absorption moderated, with spaces now taking an average of 10 months to lease. This reflects a more measured pace compared to just 2.8 months two years ago. The market totals 838 million SF across 20,582 buildings, with 21.1 million SF under construction, 75% of which remains available, pushing the availability rate to 9.7% as developers continue delivering large speculative projects.   Houston Industrial Supply & Demand Dynamics Source: CoStar Group, Inc.     Houston Demographics Source: CoStar Group, Inc. Unemployment Rate: 4.4% Current Population: 7,883,927 Households: 2,887,007 Median Household Income: $81,844   Houston’s industrial market remained active and resilient in Q3 2025. The region’s inventory reached 838 million square feet across 20,582 buildings, supported by a robust development pipeline with 21.1 million square feet under construction. Leasing demand stayed strong, reflected in 10.9 million square feet of net absorption during the quarter. Availability measured 83.2 million square feet, resulting in a 9.7% availability rate and a 7.4% vacancy rate. Additionally, investor activity remained steady, with 7.2% of the total market trading hands over the period, underscoring continued confidence in Houston’s industrial fundamentals.   Top U.S. Metros for Job Growth in Renewable Energy Source: Greater Houston Partnership    Port Houston Economic Value Source: Port Houston Statistics Statewide: $439 Billion Nationwide: $906 Billion   Houston Industrial Construction Construction activity in Houston’s industrial market remained strong in Q3 2025, with 21.1 million SF underway, one of the largest pipelines in the nation. Despite financing challenges, speculative development continues, with only about a quarter of projects pre-leased. Much of the new supply is concentrated in large-format facilities, which are taking longer to lease, while smaller properties are moving more quickly. Availability for buildings 250,000 SF or larger sits near 50%, well above the market average of 9.7%, as a surge of big-box projects hit the market. Construction is focused in suburban areas with access to labor and transit infrastructure, and although total deliveries are expected to dip to a seven-year low this year, rising groundbreakings point to increased activity in 2026 and beyond.   SF Construction Starts Source: CoStar Group, Inc.   SF Under Construction Source: CoStar Group, Inc.    Houston’s industrial market posted a sales volume of $161M in Q3 2025.   Houston Industrial Sales Volume Source: CoStar Group, Inc.   By the Numbers 5K+ SF & All Tenant | As of September 18, 2025 | Source: CoStar Group, Inc. Under Construction SF: 21.1M Net Absorption SF: 10.9M Availability Rate: 9.7% Vacancy Rate: 7.4% Inventory SF: 838M Available SF: 83.2M % of Market Sold: 7.2% Market Size Buildings: 20,582

Image of Doc Perrier Author

Doc Perrier

First Vice President & Director

Image of The Matthews Podcast — Andy Weiner of Rockstep Capital Success Story

The Matthews Podcast — Andy Weiner of Rockstep Capital

The Power of Principle-Driven Real Estate with Andy Weiner On this episode of The Matthews Podcast, guest host Patrick Graham sits down with Andy Weiner, Founder and President of RockStep Capital, a Houston-based investment firm redefining the future of community retail.   With a career spanning four decades, Andy has transformed how investors and developers view shopping centers, turning overlooked properties into thriving local hubs that anchor neighborhoods and fuel economic growth.   From Retail to Real Estate Visionary Andy’s journey began on the front lines of retail. Before founding RockStep Capital, he spent years in the retail business, giving him an operator’s eye for how customers, tenants, and communities interact. That foundation later became the cornerstone of RockStep’s investment philosophy: every property has a story, and a second act.   His move from retail into real estate investment wasn’t just a career shift; it was a mission to breathe new life into struggling centers across America. By understanding both sides of the table, the tenant and the landlord, Andy built a model that blends financial discipline with community revitalization.   The “Hometown America” Strategy At the heart of RockStep’s approach is its HomeTown America initiative: a strategy focused on revitalizing retail centers in secondary and tertiary markets that are often overlooked by institutional capital. These properties, once the center of local commerce, are being reimagined into mixed-use spaces that serve as anchors for small businesses, healthcare, and community life.   Andy describes this model as “investing in people as much as properties.” By partnering with local tenants and city leaders, RockStep transforms dated malls into vibrant town centers—where retail, entertainment, and daily services coexist.   Turning Distress into Opportunity While many see retail distress as a market headwind, Andy sees it as a generational opportunity. He explains how shifting consumer habits, e-commerce adaptation, and post-pandemic demand for convenience have created openings for creative investors.   Rather than chasing major metros, RockStep finds value in underserved cities where competition is low, but community demand is strong. This contrarian playbook has allowed the firm to deploy capital strategically and deliver consistent returns while supporting local growth.   Partnership, Purpose, and Patience For Andy, success in retail reinvention depends on partnership and long-term vision. RockStep’s projects often involve close collaboration with municipalities, lenders, and regional developers. These partnerships allow the firm to align community needs with investor goals, bridging the gap between capital and impact.   He emphasizes patience as a competitive edge, “you can’t flip communities overnight, real transformation takes time, trust, and a shared purpose.” Lessons in Leadership Andy’s leadership philosophy centers on curiosity, humility, and persistence. He believes the best leaders listen first, especially to the people who live and work in the markets they serve. From navigating rising interest rates to managing redevelopment risk, he underscores the importance of staying adaptable while keeping mission and value creation at the core.   “Don’t underestimate the power of understanding the customer,” says Andy.  “Whether you’re leasing space or raising capital, it’s all about people.” Top Takeaways for CRE Professionals Adaptive reuse and mixed-use conversions are redefining how communities shop and connect. Secondary cities are becoming prime investment opportunities for long-term value creation. Aligning capital, local government, and tenant needs unlocks sustainable redevelopment. Grounding projects in community benefit builds trust and long-term stability.   From Houston to heartland America, Andy Weiner is rewriting what it means to invest in retail, proving that with vision and persistence, legacy assets can become engines of local revival and national growth.  

Image of Houston, TX Healthcare Market Report Q3 2025 Success Story

Houston, TX Healthcare Market Report Q3 2025

Houston’s healthcare sector serves as a critical engine of economic growth, anchoring the city’s broader diversification efforts beyond its traditional energy base. The Texas Medical Center (TMC), the world’s largest medical complex, employs over 100,000 people and draws patients globally, and with the TMC3 life sciences campus under construction, Houston is positioning itself as a major healthcare hub. Combined with the metro’s relatively affordable cost of living, high median household income, and strong talent pipeline from local universities, Houston’s healthcare ecosystem is expected to remain a cornerstone.   Highlights Medical office buildings remain attractive, but looming loan maturities and higher refinancing costs motivate some owners to sell rather than refinance. Rising vacancy rates and slower lease-up periods are beginning to weigh on property performance and valuations. While construction is currently limited, Houston’s history of heavy development cycles raises long-term risks of oversupply compared to peer markets like Austin and San Antonio.   Houston Demographics Source: CoStar Group, Inc. Unemployment Rate: 4.4% Current Population: 7,883,927 Median Age: 34.3 years Household Income: $81,844   Population, Labor Force, & Income Growth Source: CoStar Group, Inc.   Rents Average asking rents rose from $26.96/SF in Q1 2022 to $28.68/SF in Q3 2025, marking a gain of roughly 6.4%. While these increases appear modest on a quarterly basis, the trend highlights consistent upward momentum, even as traditional office continues to face record-high vacancy rates and steep concessions. This measured, incremental rent growth reflects the strong underlying fundamentals of healthcare real estate in Houston, supported by the city’s rapidly expanding medical ecosystem anchored by TMC and demand from providers who require long-term, strategically located facilities.   Vacancy MOBs have held up better than traditional office, though vacancy has inched up from 21.0% in Q1 2022 to 28.1% in Q3 2025 as new supply and repositioned space entered the market. This rise masks stronger underlying fundamentals: job growth in ambulatory healthcare rose about 4% over the past year, outpacing overall office-using employment and ensuring sustained demand from providers tied to Houston’s expanding healthcare ecosystem and the Texas Medical Center.   Construction With the TMC3 life sciences campus under construction, Houston is positioning itself as a national leader in biotechnology and commercial research, aiming to rival innovation hubs like Cambridge and San Francisco. The project is projected to generate more than 26,000 jobs and billions in economic benefits, while also catalyzing additional private investment in research facilities, labs, and mixed-use developments. Beyond TMC3, multiple large-scale life sciences and healthcare-oriented developments are underway, further entrenching Houston’s role as a hub for medical advancements.   Houston Healthcare Sales Houston’s medical office investment market has remained a relative bright spot, drawing steady interest from private buyers and specialized funds. Sales volume has been resilient, with activity accelerating in 2025 after a slower 2024. Transactions totaled $55.4M in Q3 2025, the highest quarterly tally in more than two years, while pricing has held firm near $195/SF. MOBs continue to trade with compressed cap rates in the 7%–8% range, and premier properties can achieve sub-7% yields due to long-term leases and stable tenancy from healthcare providers. Recent examples, such as the Grand Parkway Professional Building trading at a 7.1% cap rate, highlight investor appetite for reliable income streams tied to Houston’s expanding healthcare base.   By the Numbers Q3 2025 | Source: CoStar Group, Inc. Sales Volume: $55.4M Cap Rate: 7.25% Price Per SF: $195 Vacancy Rate: 28% Rent Growth: – Asking Rent Per SF: $28.67 SF Under Construction: 97,552 SF Delivered: 75,135 SF Absorbed: (113,114)

Image of Houston, TX Multifamily Market Report Q3 2025 Success Story

Houston, TX Multifamily Market Report Q3 2025

Houston’s multifamily market showed mixed performance in Q3 2025 as vacancy remained elevated at 11.6%, unchanged from the prior quarter but up year-over-year, marking a 20-year high. Strong demand supported 3,100 units absorbed, yet new supply, with 4,800 units delivered and 9,000 under construction, continued to outpace leasing. Rent pressure persisted, with asking rents averaging $1,400 per unit and rent growth down 0.6%, following a negative turn in Q2 for the first time since 2010. Suburban submarkets drove most absorption, but oversupply kept concessions widespread. Despite near-record absorption earlier in the year, rent softness and elevated vacancies are expected to continue until supply moderates and demand fully catches up.   Key Findings Conditions are improving as vacancy holds at 11.6%, however rent growth remains negative at -0.6% and asking rents average $1,400, with heavy concessions needed to maintain occupancy around 93% For the first time in four years, absorption outpaced new deliveries in the first half of 2025, driving a 50-basis-point drop in the overall vacancy rate. Investors remain active with $57.5M in sales, $150K per unit pricing, and cap rates rising to 6.5%, reflecting cautious optimism as fundamentals slowly strengthen.   Houston Multifamily Supply & Demand Dynamics Source: CoStar Group, Inc.   Houston Demographics Source: CoStar Group, Inc. Unemployment Rate: 4.4% Current Population: 7,883,927 Households: 2,887,007 Median Household Income: $81,844   Houston’s economy is among the nation’s strongest, with over 300,000 more jobs than before the pandemic, though growth is slowing after several years of record gains. The metro area, now the fifth largest in the U.S. with 7.9 million people, continues to attract residents thanks to its affordability, business-friendly climate, and cultural diversity. While oil remains vital, Houston is rapidly diversifying into healthcare, biomedical research, and aerospace. The Texas Medical Center’s TMC3 project alone is expected to create 26,000 jobs and $5.2 billion in economic impact. With strong population growth, a median income above the national average, and a key role as a gateway to Latin America, Houston’s outlook remains robust and diversified.   Houston’s Largest Companies by Revenue Over $50 Billion | Source: Greater Houston Partnership ConocoPhillips Phillips 66 Sysco Exxon Mobil   Population, Labor Force, & Income Growth Source: CoStar Group, Inc.   Houston Multifamily Construction Construction activity slowed notably in Q3 2025, signaling a shift toward a more balanced supply environment. About 9,000 units were under construction, the lowest level since 2011, as elevated capital costs, tighter lending, and material cost uncertainty curbed new starts. Deliveries continued to moderate, with 4,800 units completed and 3,100 units absorbed, while groundbreaking activity in the first half of the year suggested a potential 15-year low for annual starts. Development remains concentrated in luxury mid- and high-rises in the urban core and suburban projects in fast-growing areas like Bear Creek and Northwest Houston. The pullback in construction is expected to ease pressure on the 11.6% vacancy rate and support rent stabilization in 2026.   Units Construction Starts Source: CoStar Group, Inc.   Units Under Construction Source: CoStar Group, Inc.   Houston Multifamily Sales Investment activity in Houston’s multifamily market remained steady in Q3 2025, with total sales volume reaching $57.5 million and properties trading at an average of $150,000 per unit. Investor sentiment continues to improve following a cyclical low in early 2023, with a higher number of transactions recorded in the first half of 2025 than any comparable period since 2022. Cap rates have adjusted upward to around 6.5%, reflecting a higher-return environment amid elevated 11.6% vacancy and -0.6% rent growth. Buyers are prioritizing stable, income-producing core and core-plus assets, particularly among Class A properties, which has accounted for a rising share of trades. As new supply slows and fundamentals stabilize, investor confidence is expected to strengthen further.   Houston Multifamily Sales Volume Source: CoStar Group, Inc.   By the Numbers Q3 2025 | Source: CoStar Group, Inc. Sales Volume: $57.5M Price Per Unit: $150K Cap Rate: 6.5% Vacancy Rate: 11.6% Rent Growth: (0.6%) Asking Rent Per Unit: $1.4K Under Construction: 9K Units Delivered: 4.8K Units Absorbed: 3.1K Units