Los Angeles, CA Industrial Market Report Q2 2026
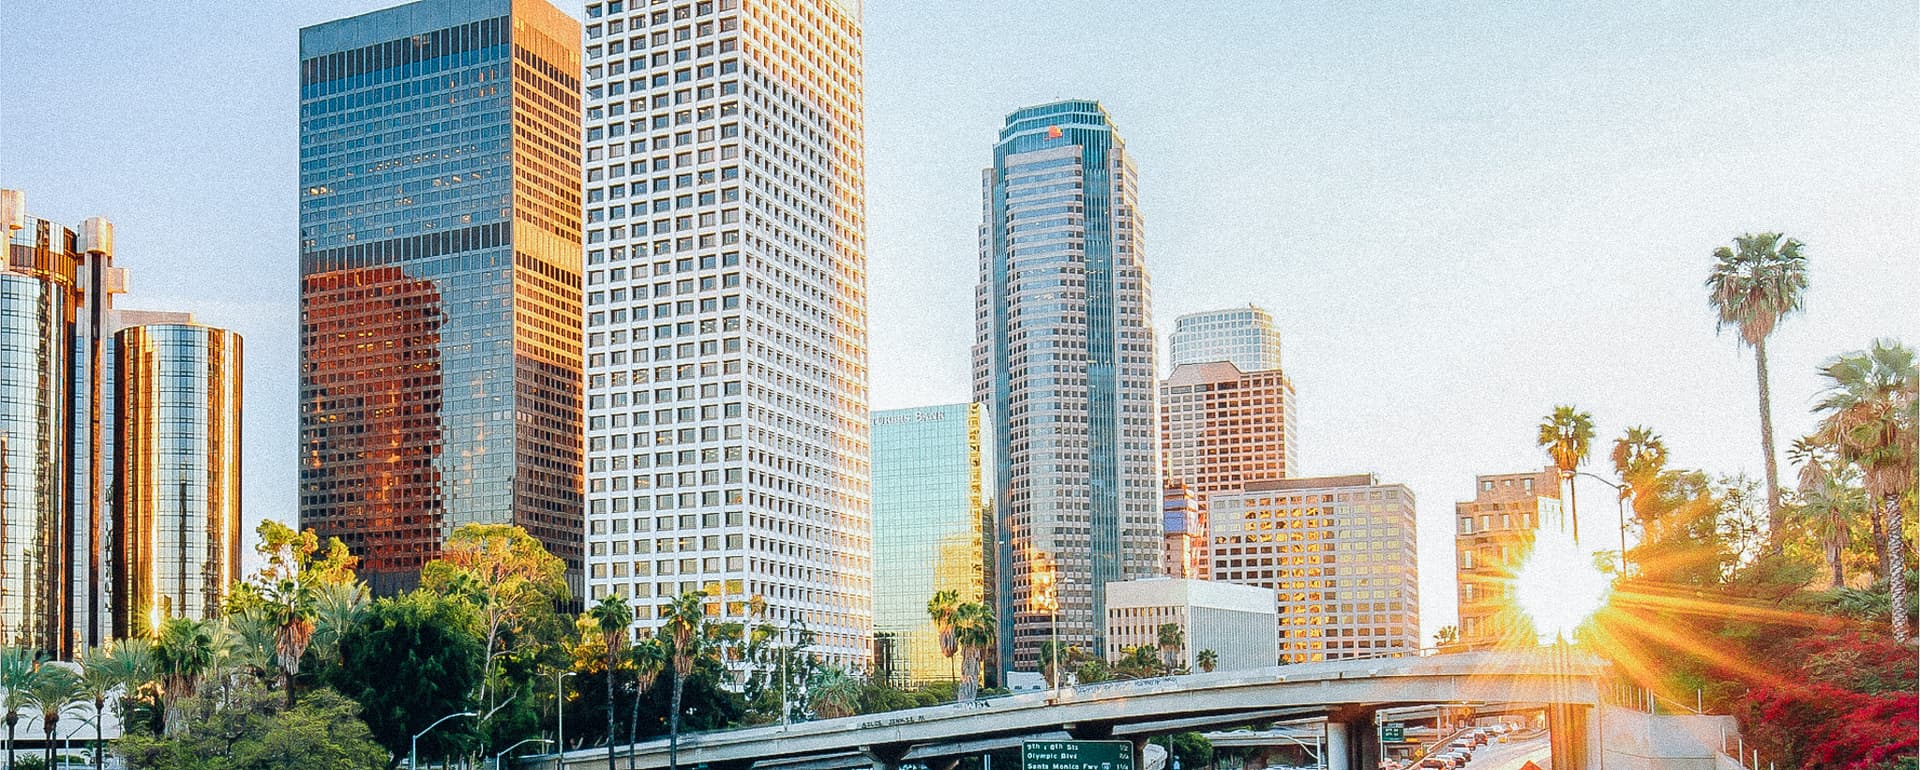
The Los Angeles industrial market moved further into recovery in the second quarter of 2026, with vacancy easing to 6.5% as record-setting leasing activity outpaced new construction. Anchored by the Port of Los Angeles and Long Beach, the nation’s largest port complex, Los Angeles remains one of the most important industrial markets in the country even as population declines, softer import volumes, and elevated interest rates continue to weigh on near-term demand.

Key Findings: Los Angeles Industrial Market Q2 2026
- Vacancy remains elevated despite improving leasing fundamentals. Vacancy reached 6.5% as new supply and uneven demand pressured occupancy. Leasing activity hit a record high, with net absorption returning positive following a weak first quarter of 2026.
- Rents are still declining, but the pace of correction is slowing. Average asking rents fell 4.5% year over year and are down more than 20% from their peak. Landlords continue to offer concessions to attract tenants.
- Capital is returning to the market as financing conditions improve. Institutional investors and REITs remain active buyers. Limited future construction and expectations for declining vacancy in 2027 are supporting renewed investor confidence.
Los Angeles Industrial Market By the Numbers
Source: CoStar Group, Inc.
- Sales Volume: $1.3 billion
- Asking Rent Per SF: $16.90
- Vacancy Rate: 6.50%
- Rent Growth: -4.50% year over year
- Average Cap Rate: 5.80%
- Average Price Per SF: $308
- Under Construction: 3.1 million SF
- Delivered: 263,000 SF
- Net Absorption: 1.1 million SF
Los Angeles County remains one of the nation’s largest and most diversified economies, supported by global trade, entertainment, aerospace, technology, manufacturing, and tourism. While the region has experienced a population decline over the last five years and ongoing affordability challenges, its deep labor pool, world-class universities, and concentration of major employers continue to support long-term economic fundamentals.
Industrial Demand Rebounds As New Supply Slows
Demand improved across the Los Angeles industrial market during the second quarter, although the recovery remains uneven. Nearly 950 new leases were signed, with leasing volume surpassing 12 million square feet, the highest quarterly total on record. Tenant move-ins exceeded move-outs, resulting in 1.1 million square feet of positive net absorption after more than 3 million square feet of negative absorption in the first quarter. Limited deliveries of just 263,000 square feet helped push vacancy down to 6.5%. Although population declines, softer import volumes, and elevated interest rates continue to weigh on demand, active leasing, declining sublease availability, and a constrained construction pipeline suggest the market is steadily moving toward a more balanced supply-demand environment.
Absorption, Deliveries, and Vacancy. Source: CoStar Group, Inc.
Los Angeles Industrial Rent Trends
As tenants gained greater negotiating leverage, average asking rents declined to $16.90 per square foot, down 4.5% year over year. Rent declines have been most pronounced in port-oriented submarkets such as Long Beach and Carson, while the San Fernando Valley, San Gabriel Valley, and City of Industry have seen more modest pricing adjustments due to limited modern inventory. Although rents remain below recent peaks, the pace of decline has slowed, suggesting pricing is beginning to stabilize as leasing fundamentals improve.
Asking Rents Per SF & Rent Growth. Source: CoStar Group, Inc.
Construction Activity Slows Across Los Angeles Industrial Submarkets
Los Angeles’ development pipeline has contracted significantly from recent highs as developers respond to softer tenant demand and elevated vacancy. Approximately 3.1 million square feet remains under construction, with roughly 40% of the pipeline preleased, reflecting a more cautious approach to new development. Construction activity is concentrated in submarkets with limited modern inventory, including Long Beach, the City of Industry, Santa Fe Springs/La Mirada, Santa Clarita Valley, and Antelope Valley. Most projects range between 100,000 and 250,000 square feet, helping limit future supply growth and support long-term market fundamentals.
Construction Starts. Source: CoStar Group, Inc.
Los Angeles Industrial Investment Sales
Investment activity remains healthy despite ongoing pricing adjustments across the Los Angeles industrial market. Sales volume exceeded $1.3 billion in the second quarter as financing conditions improved and bid-ask spreads narrowed. Average pricing for institutional warehouse transactions remained near $325 per square foot, while the broader market averaged $308 per square foot. Cap rates have expanded into the mid-5% to 6% range, reflecting higher borrowing costs and softer rent growth, though institutional investors and REITs continue to account for roughly 30% of acquisition activity. Looking ahead, constrained supply, improving occupancy fundamentals, and Los Angeles’ high barriers to entry are expected to support values over the long term, though elevated vacancy and slower trade activity remain near-term risks.
Investment Volume. Source: CoStar Group, Inc.
Performance by Los Angeles Industrial Submarket
Source: CoStar Group, Inc.
| Metric | Central/Mid-Cities | South Bay/Westside | San Fernando Valley | Los Angeles County |
|---|---|---|---|---|
| Vacancy | 6.4% | 7.4% | 5.9% | 6.5% |
| Asking Rent (SF) | $15.75 | $18.40 | $19.60 | $16.90 |
| Rent Growth | -4.6% | -4.5% | -4.4% | -4.5% |
| Deliveries (SF) | 70K | 88K | -24K | 263K |
| Starts (SF) | 160K | 180K | 0 | 342K |
| Under Construction (SF) | 877K | 791K | 794K | 3.1M |
| Absorption (SF) | -173K | 627K | -586K | 1.1M |
| Transaction Volume ($) | $557M | $235M | $228M | $1.3B |
| Average Cap Rate | 5.6% | 6.0% | 5.4% | 5.8% |
| Average Price Per SF | $297 | $329 | $345 | $308 |
The San Fernando Valley continues to post the strongest occupancy fundamentals with the region’s lowest vacancy rate (5.9%) and highest average asking rents ($19.60/SF), reflecting its limited supply of modern industrial product. Central/Mid-Cities remains the market’s largest investment hub, generating $557 million in sales volume during the quarter. The South Bay/Westside remains the region’s primary port-oriented industrial hub and posted positive absorption during the quarter despite carrying the market’s highest vacancy rate.