

Sacramento Industrial Market Report Q3 2026
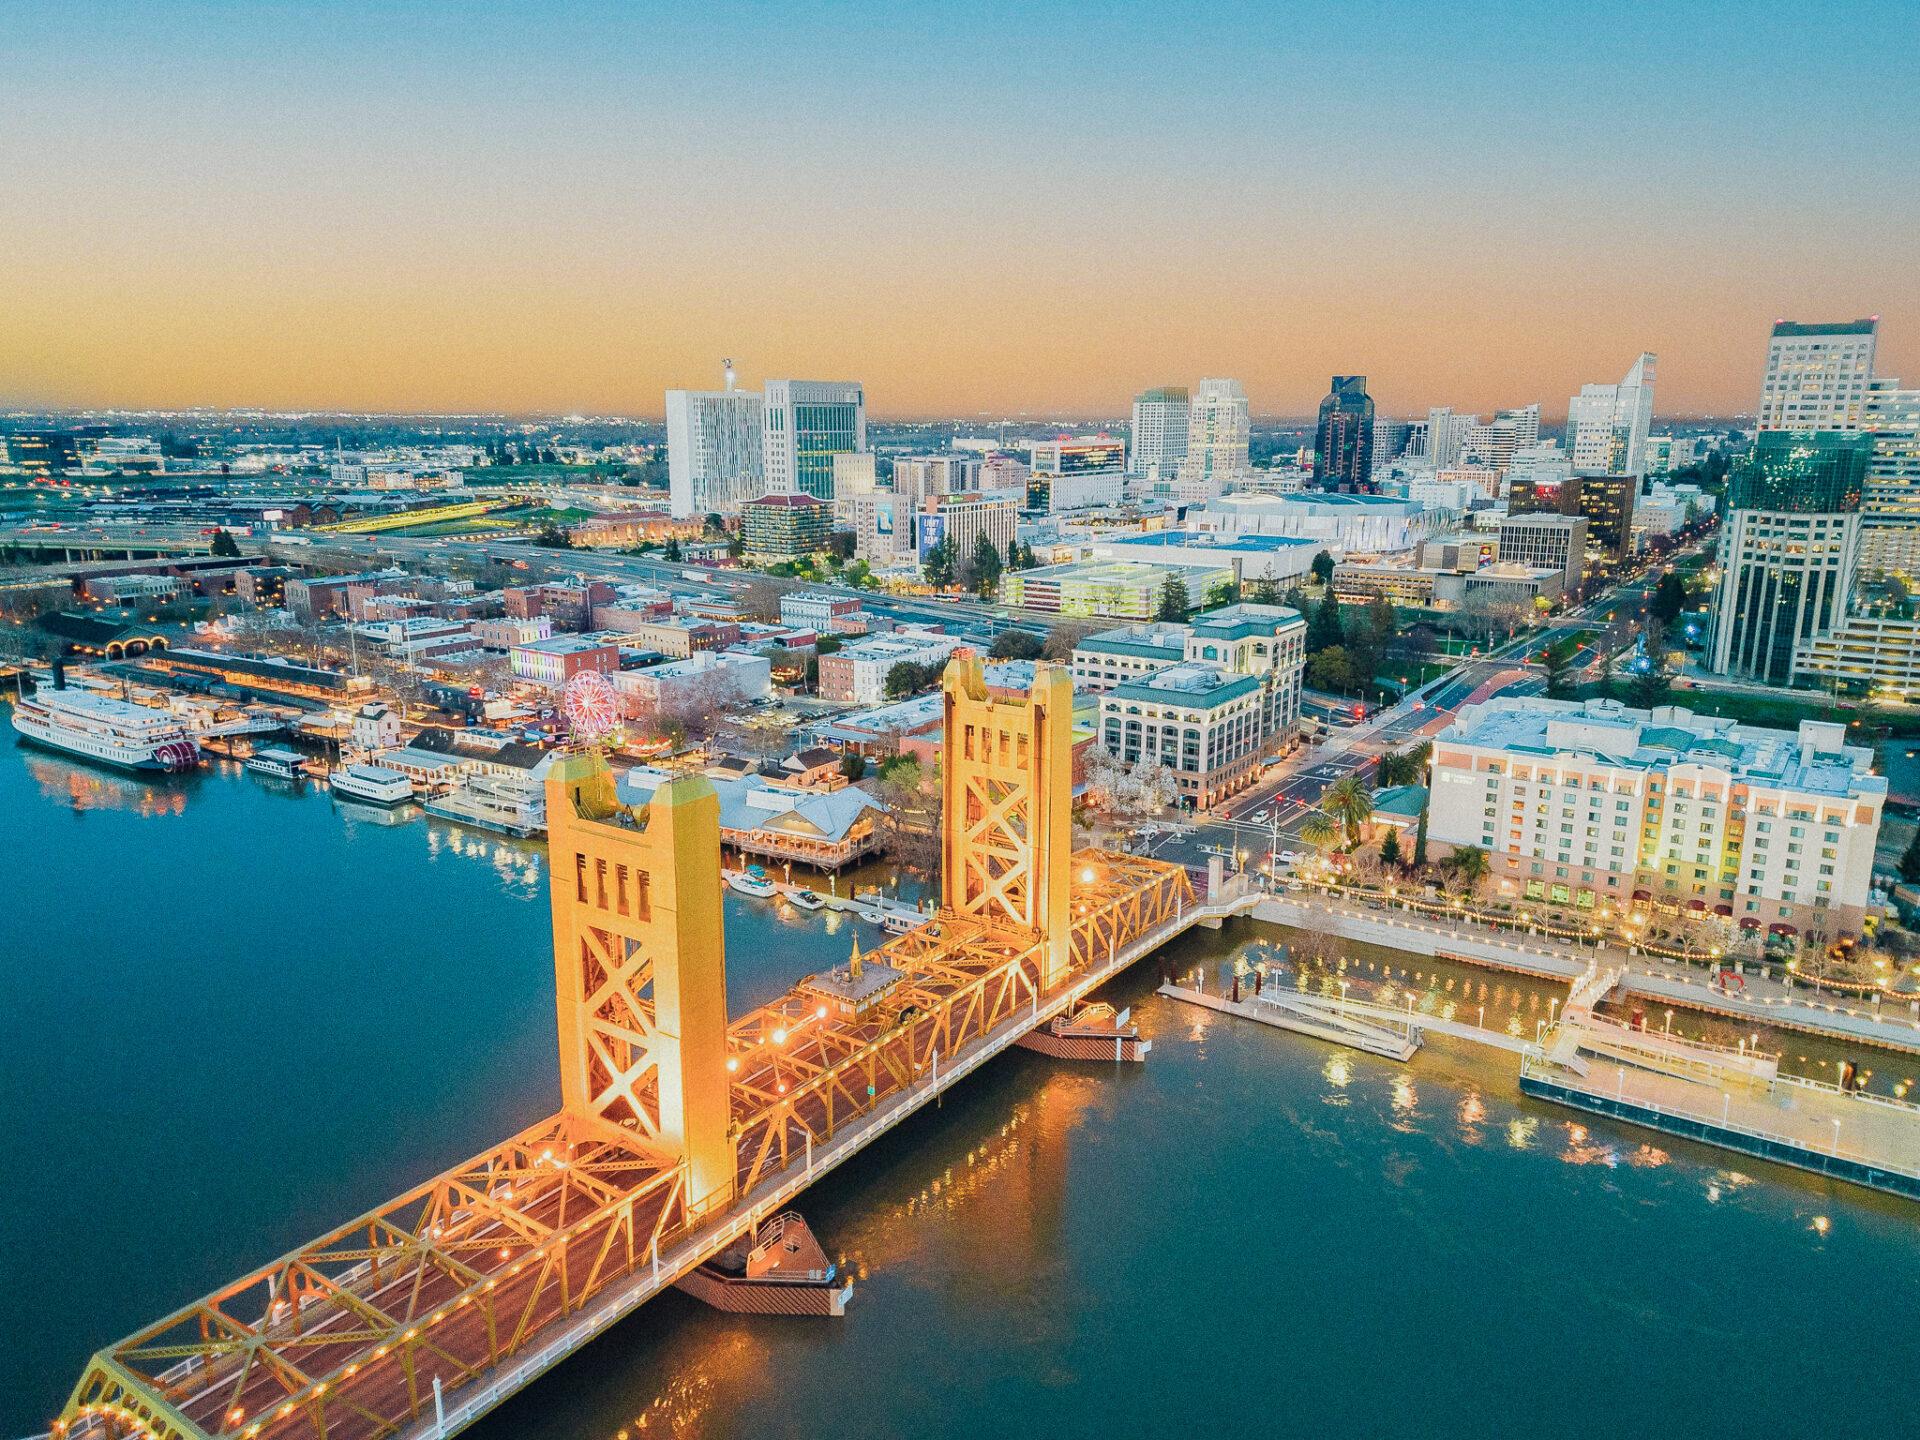
Sacramento industrial vacancy edged up to 6.9% in Q3 2026, 47 basis points looser than a year earlier, even as trailing-12-month deliveries fell 36% to 897K SF. The market absorbed 167K SF in the quarter, but trailing-12-month absorption remains negative at 79K SF. This Matthews™ Research report covers Sacramento industrial demand, supply, and investment trends for owners and investors.
Sacramento Industrial Market Snapshot, Q3 2026
- Vacancy: 6.9%, up 47 bps year over year
- Q3 net absorption: 167K SF, versus 42K SF in Q3 2025
- Trailing-12-month deliveries: 897K SF, down 36% from the prior 12-month period
- Asking rent: $11.78/SF, up 0.4% year over year
- Cap rate: 7.04%
- Price per SF: $154
- Trailing-12-month sales volume: $1.2B, up 75% year over year
Sacramento Industrial Demand: Quarterly Absorption Improves, 12-Month Total Stays Negative
Sacramento absorbed 167K SF in Q3 2026, against 42K SF in the same quarter last year. Vacancy is 6.9%, 47 bps looser than Q3 2025 and 331 bps above the Q1 2022 low of 3.6%.
Trailing-12-month absorption of negative 79K SF compares with 120K SF a year earlier. Asking rent of $11.78/SF is up 0.4% year over year and within 1% of the Q2 2026 peak of $11.80/SF.
Sacramento Submarket Highlights
East Sacramento is the tightest submarket at 0.0% vacancy. Auburn/Newcastle leads rent growth at 2.2%.
Sacramento Industrial Supply: Deliveries Fall 36%
Sacramento delivered 55K SF in Q3 2026 and 897K SF over the trailing 12 months, down 36% from the prior 12-month period. Q3 deliveries were less than half of last year’s 530K SF. Annual deliveries peaked at 5.87M SF in 2000.
Space under construction equals 1.0% of inventory and is concentrated in Natomas/Northgate, where it equals 5.0% of existing stock.
Sacramento Industrial Investment Market: Volume Jumps, Read It as Directional
Sacramento recorded $1.2B in industrial sales over the trailing 12 months, up 75% against the prior period. Q3 2026 accounted for $475M. The high-water mark for the series is $1.6B in 2021.
Q3 volume is 2.4 times the prior four-quarter average, so volume should be read as directional.
Cap Rates and Pricing
Sacramento industrial cap rates average 7.04% and have compressed for two consecutive quarters. Pricing sits at $154/SF, higher for two consecutive years.
What This Means for Sacramento Industrial Owners and Investors
Takeaway: Falling deliveries are starting to ease supply pressure, and Q3 absorption improved, but vacancy at 6.9% and negative 12-month absorption mean tenants still hold leverage. Rents sit within 1% of their peak, so owners should defend occupancy before pushing rate. Buyers entering at a 7.04% average cap rate are buying at a level that has begun to compress, and the volume surge in Q3 should not be treated as a trend.
Sacramento Industrial Market FAQs
What is the Sacramento industrial vacancy rate in Q3 2026?
Sacramento industrial vacancy is 6.9% in Q3 2026, 47 bps higher than Q3 2025.
What is the average industrial asking rent in Sacramento?
Asking rent in Sacramento is $11.78/SF in Q3 2026, up 0.4% year over year.
What is the average industrial cap rate in Sacramento?
The average Sacramento industrial cap rate is 7.04% in Q3 2026.
How much industrial space was delivered in Sacramento?
Sacramento delivered 55K SF in Q3 2026 and 897K SF over the trailing 12 months, down 36% year over year.
Source: Matthews™ Research, CoStar Group, Inc., RCA, BLS. Download the full Sacramento Industrial Market Report using the form below.


