AuthorKeegan Mulcahy
First Vice President & DirectorSan Diego, CA

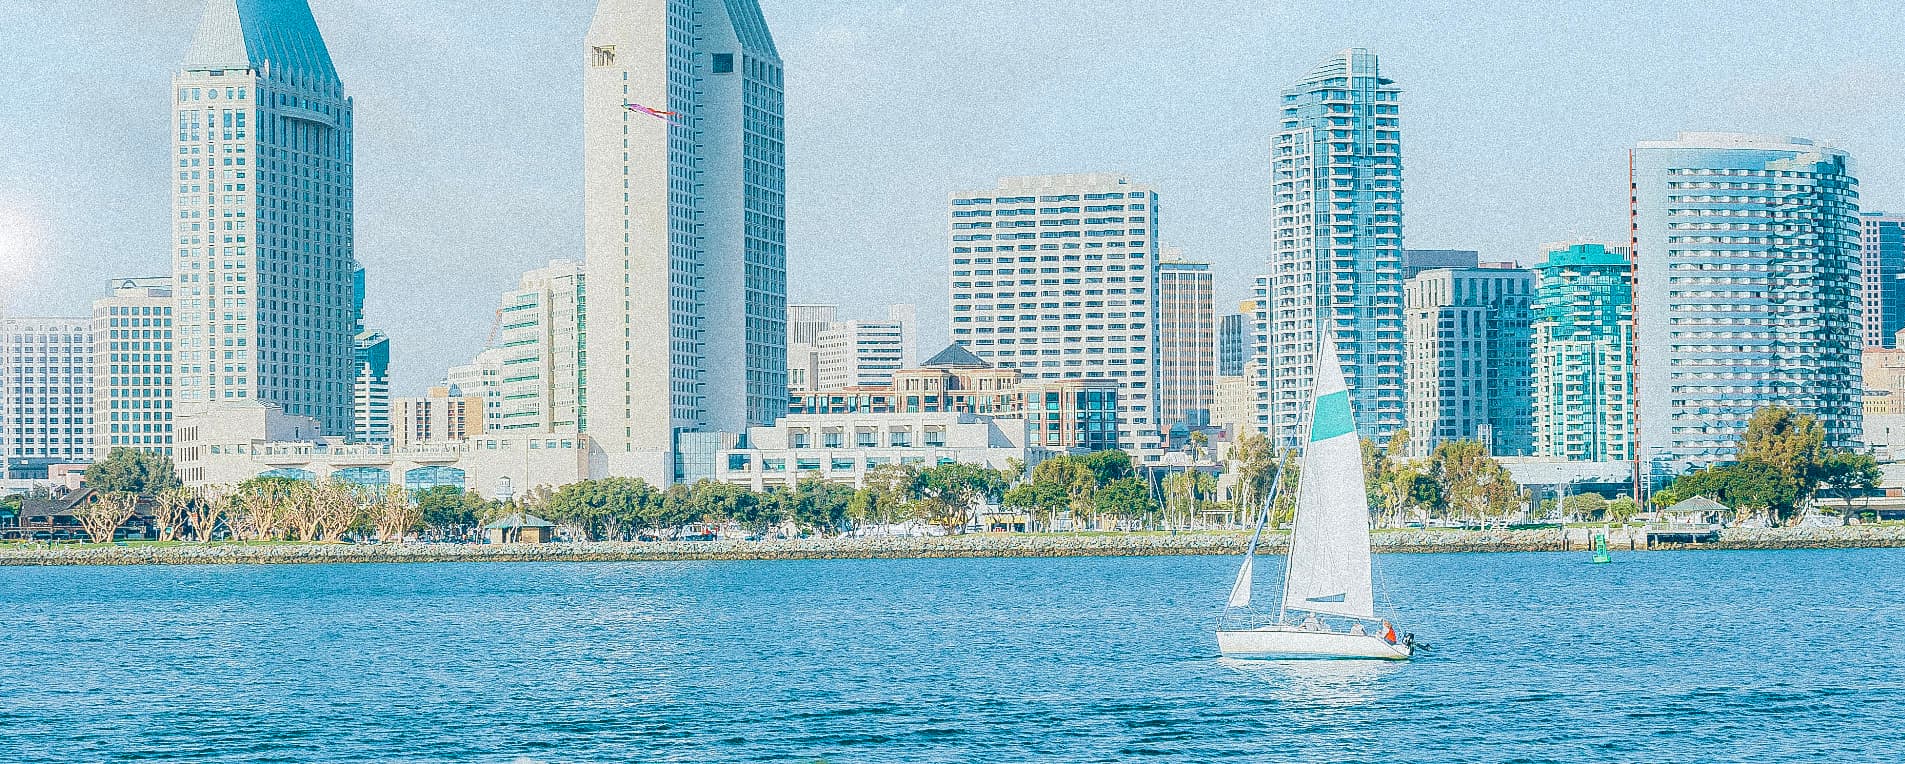
San Diego’s industrial market ended Q3 2026 with 8.5% vacancy, asking rent of $21.66 per square foot, and cap rates averaging 6.07%. This Matthews™ Research report covers San Diego industrial demand, new supply, pricing, and investment activity for owners, investors, and tenants. Download the full Q3 2026 San Diego Industrial Market Report below.
San Diego absorbed 118K SF in Q3 2026, against -292K SF in the same quarter last year. Vacancy is 8.5%, 53 bps looser than Q3 2025. North Beach Cities is the tightest submarket at 0.0% vacancy; Chula Vista/National City posted the smallest rent decline at -0.1%. Trailing-12-month absorption of 643K SF compares with -1.62M SF a year earlier. Asking rent of $21.66/SF is down 1.0% year over year and 1.3% below the Q4 2025 peak of $21.96/SF.
San Diego delivered 847K SF in Q3 and 2.17M SF over the trailing twelve months (-10% versus the prior TTM period). Space under construction equals 0.3% of inventory, concentrated in Kearny Mesa at 1.2% of its stock. Annual deliveries peaked at 8.00M SF in 2000. Q3 deliveries were 580% above last year’s 125K SF. The 581K SF pipeline equals about three and a half quarters of absorption at the trailing pace.
San Diego recorded $2.2B in sales over the trailing twelve months, +34% against the prior TTM period; Q3 accounted for $456M. The high-water mark in this series is $4.4B in 2021.
San Diego cap rates average 6.07%, up for 18 straight quarters. Pricing sits at $304/SF, lower for 3 consecutive years. The cap rate is 89 bps above the Q1 2022 low of 5.18%.
Compare with the prior quarter in our San Diego Industrial Market Report Q2 2026 or see neighboring conditions in the Los Angeles Industrial Market Report Q3 2026.
For more information on San Diego market conditions, contact Keegan Mulcahy, Market Leader in San Diego, CA, at (310) 955-1782 or keegan.mulcahy@matthews.com.