

Tampa Retail Market Report Q3 2026
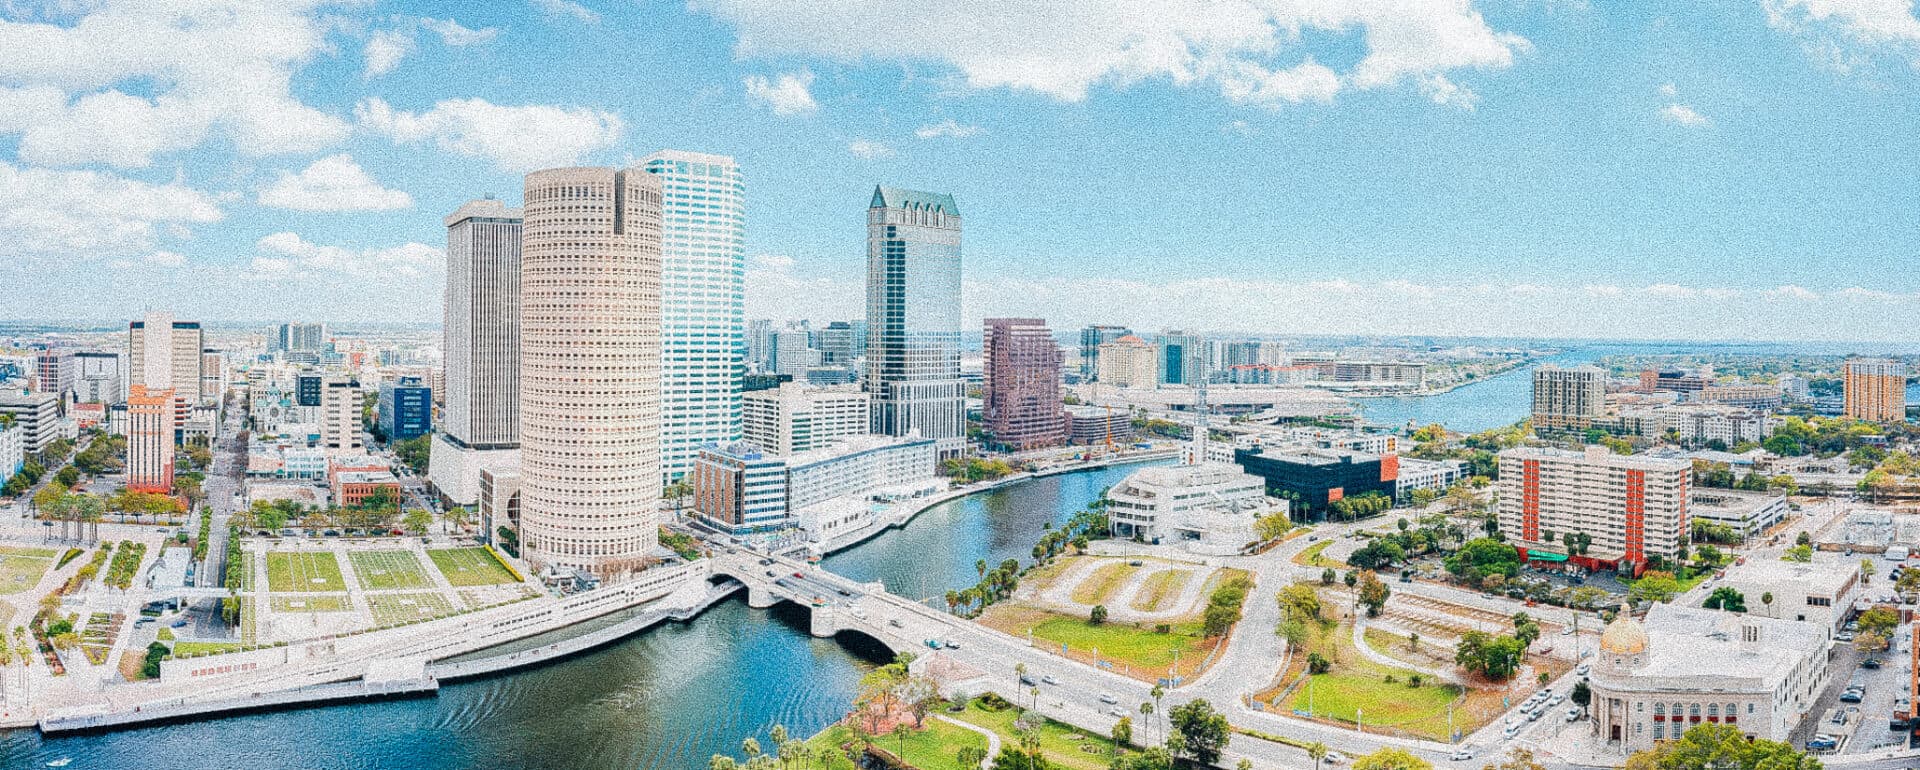
Tampa retail absorbed 435K SF in Q3 2026, up from 80K SF a year earlier, and asking rent reached a record $27.82/SF, up 2.5% year over year. Trailing-12-month deliveries climbed 29% to 1.02M SF, and vacancy is 3.6%, 22 basis points looser than Q3 2025. This Matthews™ Research report covers Tampa retail demand, supply, and investment trends for owners and investors.
Tampa Retail Market Snapshot, Q3 2026
- Vacancy: 3.6%, up 22 bps year over year
- Q3 net absorption: 435K SF, versus 80K SF in Q3 2025
- Trailing-12-month deliveries: 1.02M SF, up 29% from the prior 12-month period
- Asking rent: $27.82/SF, up 2.5% year over year and a record
- Cap rate: 6.67%, up for 17 consecutive quarters
- Price per SF: $278, a record
- Trailing-12-month sales volume: $1.6B, up 14% year over year
Tampa Retail Demand: Strong Absorption Drives Record Rent
Tampa absorbed 435K SF in Q3 2026, against 80K SF in the same quarter last year. Vacancy is 3.6%, 22 bps looser than Q3 2025 and 63 bps below the Q1 2021 peak of 4.2%.
Trailing-12-month absorption of 385K SF compares with negative 307K SF a year earlier. Asking rent of $27.82/SF is up 2.5% year over year and a record.
Tampa Submarket Highlights
East Tampa is the tightest submarket at 1.2% vacancy. Hernando County leads rent growth at 3.4%.
Tampa Retail Supply: Deliveries Climb 29% From a Low Base
Tampa delivered 139K SF in Q3 2026 and 1.02M SF over the trailing 12 months, up 29% from the prior 12-month period. Annual deliveries peaked at 3.83M SF in 2007.
Space under construction equals 0.6% of inventory and is concentrated in Southeast Hillsborough, where it equals 2.7% of existing stock. The 1.08M SF pipeline equals about eleven quarters of absorption at the trailing pace.
Tampa Retail Investment Market: Volume Rises, Cap Rates Keep Expanding
Tampa recorded $1.6B in retail sales over the trailing 12 months, up 14% against the prior period. Q3 2026 accounted for $366M. The high-water mark for the series is $1.9B in 2021.
Cap Rates and Pricing
Tampa retail cap rates average 6.67%, up for 17 straight quarters and 45 bps above the Q2 2022 low of 6.22%. Pricing sits at $278/SF, higher for 16 consecutive years and at a record.
What This Means for Tampa Retail Owners and Investors
Takeaway: Tight vacancy and record rent favor owners on renewals and new leases, and the 0.6% construction pipeline limits near-term competition. Buyers face record pricing of $278/SF against a cap rate that has expanded for 17 quarters, so underwriting should lean on rent growth in submarkets such as East Tampa (1.2% vacancy) and Hernando County (3.4% rent growth).
Tampa Retail Market FAQs
What is the Tampa retail vacancy rate in Q3 2026?
Tampa retail vacancy is 3.6% in Q3 2026, 22 bps higher than Q3 2025.
What is the average retail asking rent in Tampa?
Asking rent in Tampa is $27.82/SF in Q3 2026, up 2.5% year over year and a record.
What is the average retail cap rate in Tampa?
The average Tampa retail cap rate is 6.67% in Q3 2026, up for 17 consecutive quarters.
How much retail space was delivered in Tampa?
Tampa delivered 139K SF in Q3 2026 and 1.02M SF over the trailing 12 months, up 29% year over year.
Source: Matthews™ Research, CoStar Group, Inc., RCA, BLS. Download the full Tampa Retail Market Report using the form below.


