Texas Owner-User Gas Stations: Market Trends and Exit Considerations
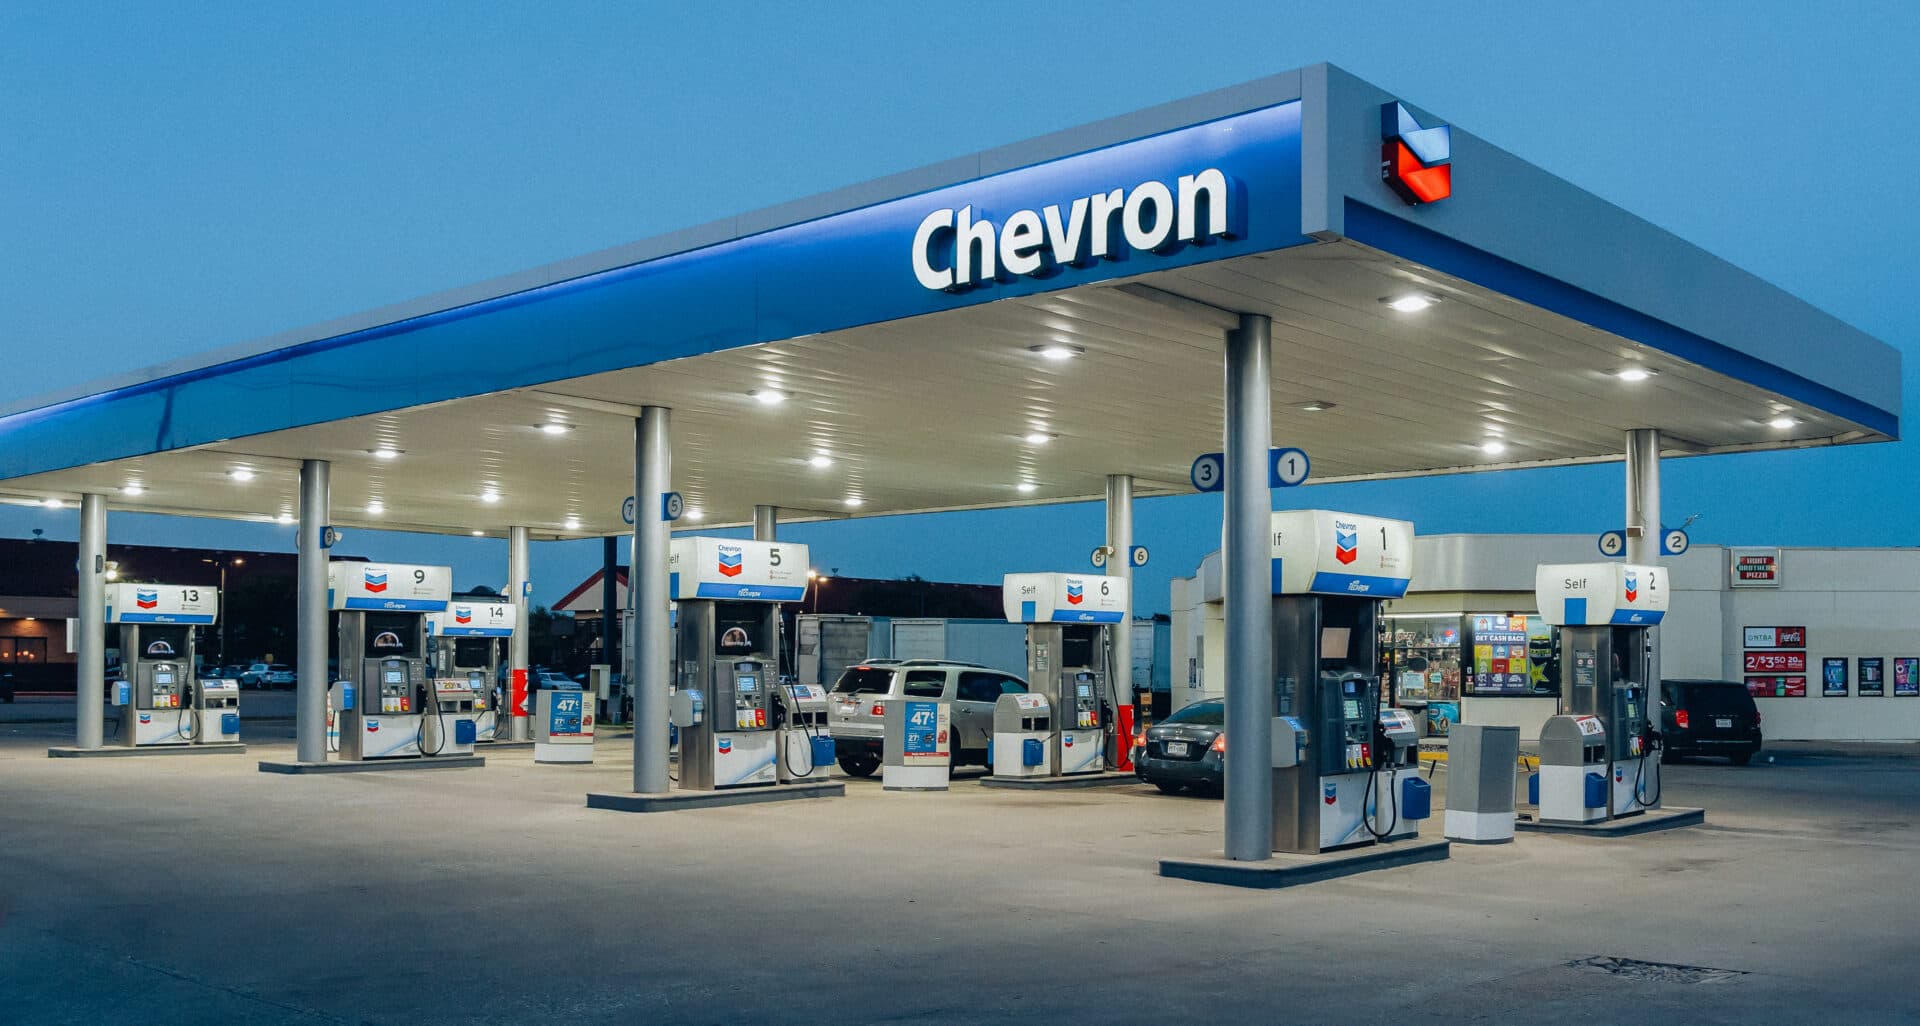
Owner-operated gas stations require a different valuation approach than traditional net lease investments. A corporate-guaranteed 7-Eleven on an absolute NNN lease can generally be valued based on contractual rent and prevailing cap rates. An owner-operated gas station is different because a buyer is evaluating both the real estate and the business operating on it.For an owner considering a sale, that means the likely value of the property often comes down to three questions:
- How much debt can the business support?
- What is the real estate worth on its own?
- What upside can the still unlock?
Understanding how buyers answer those questions can help an owner determine not only what the property may be worth, but also which type of buyer is most likely to pay for that value.
How Buyers Determine What They Can Pay
Texas has a deep owner-user buyer pool, but many of those buyers rely heavily on SBA financing. As a result, documented business performance often sets the practical ceiling on what they can pay.
Instead of starting with property NOI and applying a cap rate, an buyer will typically look at the store’s Seller’s Discretionary Earnings (SDE), determine how much debt that cash flow can support, and work backward to a purchase price.
| Step | Assumption |
| Seller’s Discretionary Earnings (SDE) | Based on tax returns, not pro forma |
| Less owner salary | Approx. $80K for a working owner of a $5M+ revenue store |
| Divide by DSCR | 1.25x common lender threshold |
| Solve for loan at 7% / 25 years | Each $100K borrowed equals approx. $8,485 in annual payments |
| Gross up for 20% down | Loan / 0.80 = maximum defensible price |
Using those assumptions, the pricing ceiling becomes clear:
| SDE | Cash for debt service | Max annual payment | Max loan | Max price |
| $300K | $220K | $176K | ~$2.07M | ~$2.6M |
| $400K | $320K | $256K | ~$3.02M | ~$3.8M |
| $550K | $470K | $376K | ~$4.43M | ~$5.5M |
At a $3.8 million purchase price, for example, a buyer may need roughly $950,000 in cash at closing between the down payment, closing costs, and working capital. Inventory is generally purchased separately and can add another $200,000 to $550,000 on a high-volume store. Those requirements can narrow the buyer pool before negotiations even begin.
Several financing variables can also affect what a buyer is ultimately able to offer:
- Loan structure. A 25-year SBA 7(a) structure produces more favorable debt service than financing part of the acquisition over a shorter business-loan term. A shorter blended amortization can reduce purchasing capacity by 15% to 20% or more.
- Interest rates. A 100-basis-point movement in rates can shift the pricing ceiling by roughly 7% to 8%.
- Seller financing. In some transactions, a seller note can help bridge the gap between what the property’s cash flow supports and the owner’s target price.
Operation upside can expand the buyer pool
Current financial performance matters, but it does not always tell the whole story.
Across independent Texas convenience stores, performance can vary significantly depending on management and owner involvement. Recent examples include:
- A rural North Texas station where inside sales fell to roughly one-third of historical levels and fuel volume dropped to about one-fifth, despite no meaningful change in the site, brand, or traffic count.
- A two-year-old suburban DFW store along a 30,000-plus VPD corridor that underperformed despite its strong location.
- A branded interchange property where cash flow declined by roughly one-third under absentee ownership while a leasable suite also went dark.
A buyer will try to determine whether weak performance reflects the property itself or the way the business has been operated. Fuel volume that significantly trails traffic counts, for example, may point to an execution problem rather than a location problem.
That distinction can matter during a sale. A buyer may give some credit to opportunities such as improving merchandising, extending operating hours, reopening a kitchen, strengthening the fuel program, or leasing vacant space.
However, buyers are more likely to pay for that upside when it can be supported by historical results. If current income is below prior levels, documented sales history can help show that the decline is operational rather than structural.
When Buyers May Value Real Estate More Than the Business
Not every fuel property will achieve its highest value by being sold to another operator.
If store-level cash flow cannot support the desired price, the underlying real estate may become more important. Buyers may look at traffic counts, signalization, corner position, parcel size, surrounding growth, and alternative uses to determine whether the site has value beyond the existing business.
One Dallas-area station, for example, sold to a developer rather than another operator. The transaction was driven by the property’s land value, hard-corner location, and fit with a coffee user’s site criteria rather than its fuel and inside sales. That same dynamic can apply to sites with potential for a QSR, car wash, drive-thru concept, retail pad, or other redevelopment strategy.
For an owner, this is ultimately a buyer-selection issue. If the operating business supports the property’s value, another operator may be the strongest buyer. If the land or redevelopment opportunity supports a higher number, marketing the property to developers or other real estate users may produce a different result.
What market headwinds mean for the future of the property
Owner-operators are dealing with a more competitive operating environment. Larger chains are expanding, store-level costs remain elevated, and some revenue streams carry more uncertainty than others.
Those conditions do not automatically reduce the value of a property, but they do affect how a buyer is likely to evaluate it.
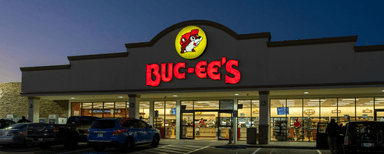
- Couche-Tard, Casey’s, Sunoco, Buc-ee’s, and other large operators continue to expand, while fuel offerings from Walmart, Costco, and other retailers create additional competition.
- Store-level economics. Roughly 43% of independents report declining inside sales, while tobacco volumes and higher labor expenses have created additional pressure on margins.
- Yield pressure. Narrower fuel margins, tighter store economics, and higher debt service can lead buyers to take a more conservative view of future cash flow.
- Deferred capital needs. Aging equipment can create significant future expenses. Underground storage tank replacement alone can cost $250,000 to $500,000 per tank.
- Skill-game income. Buyers are already discounting this revenue by roughly 20% to 35% because of its regulatory risk and uncertainty.
For an owner-operator considering a sale, these are the areas that are likely to receive the most attention during diligence. A buyer may not give full credit to every dollar of current income, particularly when that income is less predictable, and future capital needs may also influence an offer.
The better an owner-operator understands those adjustments before going to market, the fewer surprises there are likely to be during negotiations.
Current Texas offerings reflect distinct buyer profiles
Texas fuel properties are trading differently by market and by buyer type. For owner-operator, understanding these differences can help identify which buyer pool is most likely to see value in the property and what factors will drive their underwriting.
- DFW Metro
DFW has the state’s deepest owner-user buyer pool and one of the highest levels of SBA dependence. Product ranges from small unbranded corner stores to renovated branded sites with meaningful inside sales. Buyers often place more weight on location and traffic than physical condition, which narrows the pricing spread between tired and recently updated stores. A recurring opportunity is fuel volume that lags frontage traffic. Outlying counties east and southwest of the metro also trade at a discount to the core while benefiting from similar rooftop growth, improving the value-add case. - West Texas
West Texas is more often portfolio product than owner-user product. Multi-store packages across Lubbock, San Angelo, and the Permian Basin appeal to platform buyers that can spread supply agreements and management overhead across multiple locations. Basis per store is lower, real estate is less expensive, and many assets are former corporate stores in solid physical condition. - Houston
Houston has the widest pricing dispersion in the state. Operator-scale stores with conventional inside and fuel volumes sit at one end of the market; inner-loop and inner-suburb parcels priced on redevelopment potential sit at the other. Freight-corridor properties form a third category, where diesel volume, contract terms, and truck access matter more than merchandise sales. Houston also has a high concentration of ancillary income from gaming, check cashing, and rented pads, which buyers may evaluate differently based on the quality and durability of each income stream. - East Texas
In East Texas, acreage can materially influence value. Truck stops and highway sites often include 5 to 20 acres, creating excess-land optionality that does not appear in the operating statement. Tyler and the Highway 69 corridor also include multi-revenue stores where specialty retail and lottery account for a larger share of gross income. Prospective buyers are likely to evaluate those revenue streams separately based on their durability and risk. - San Antonio, Central, and Rural Texas
These markets include balanced performers where fuel and inside sales contribute more evenly, along with multi-use opportunities such as RV parks, QSR pads, and retail additions on 10-plus-acre fuel sites. Basis is generally lower, but the owners may encounter a thinner and more cash-dependent buyer pool, as rural SBA appraisals can be harder to support.
Cross-market pricing patterns
Across Texas, the factors that drive value can vary significantly by property type, income mix, and likely buyer.
Fuel-heavy sites can distort merchandise-based multiples. A store with modest inside sales and 70,000 gallons per month on several acres may appear expensive on merchandise revenue alone. For owners, this means prospective buyers are likely to evaluate the full operating profile rather than inside sales in isolation.
Ancillary income is another key underwriting variable. Gaming, check cashing, vape, lottery, and tenant rent all contribute to current asking prices, but their income quality differs. Contractual tenant rent generally warrants separate real estate underwriting, while skill-game revenue receives the heaviest discount. Buyers are reducing gaming income by 20% to 35% before making offers.
Buyer alignment matters. Short-term single-tenant NNN properties trade to investors based largely on renewal probability. Multi-store packages trade to platforms. High-basis metro parcels trade to developers. Marketing the asset to the wrong buyer group can generate activity without producing executable offers.
The extremes of the price range also have the thinnest buyer pools. Sub-$1M sites may require $150K to $250K of cash at closing, which aligns with the deepest part of the SBA buyer pool. Above roughly $8M, buyers generally need documented SDE well into seven figures on tax returns, narrowing the market to larger cash and platform buyers.
Owner-user comparable pricing. Across the Texas owner-user set, properties priced at roughly 1.4x to 2.1x annual gross revenue, with a median near 1.55x. On the monthly inside-sales multiple many operators use, the range was about 18x to 41x, with a 33x median. Asking prices ranged from $1.3M to $7.5M, with a $2.5M median. A store generating $60,000 in monthly inside sales and $32,000 outside priced at $2.0M, while one generating $145,000 inside and $135,000 outside priced at $5.3M. The consistency across brands and markets makes the multiple a useful first screen, not a substitute for full underwriting.
Vacant stores show a materially larger discount. The one dark store in the Texas set was priced at roughly 0.67x its own historical annual gross revenue versus a 1.55x median for operating stores. The same fuel infrastructure and corner can therefore trade at less than half the operating-store multiple. For a prospective owner-user that can verify historical performance and see a credible path to reopening the business may view that discount as an opportunity to recover value.
A Sale-Leaseback Can Create Another Exit Path
An owner-operator does not necessarily have to sell the operating business to monetize the real estate. In a sale-leaseback, the owner-operator sells the property to a net lease investor and continues operating the business under a long-term NNN lease. This creates a different buyer pool and a different valuation framework.
Across 190 Texas fuel and convenience NNN comparables, the median cap rate is 5.40%, but tenant credit creates a significant pricing difference.
| Tenant type | Comps | Median cap | Middle range | Median price |
| Corporate credit (7-Eleven, Stripes, Circle K, Murphy) | 120 | 5.25% | 5.00% to 5.40% | $5.87M |
| Independent, local, and dealer-branded | 70 | 7.50% | 6.25% to 7.75% | $3.50M |
Corporate-credit properties in the comp set traded at a 5.25% median cap rate, compared with 7.50% for independent, local, and dealer-branded tenants. That 225-basis-point spread largely reflects differences in tenant credit and lease quality. On $350,000 of annual rent, the difference between the two cap rates equates to roughly $2.0 million of value on the same underlying real estate.
Lease structure also factors into how investors evaluate a sale-leaseback, although the comps suggest that rent growth alone does not determine pricing. Leases with 7.5% to 10% increases every five years traded at median cap rates between 5.30% and 5.38%, while leases with 2% annual increases had a 7.50% median. Property age had a smaller impact, with 2020-and-newer construction trading at a 5.35% median compared with 6.25% for pre-2010 properties. Remaining lease term also had a relatively modest effect in this comp set.
For an owner considering a sale, a sale-leaseback can provide another way to monetize the real estate without giving up the operating business. The property is sold to a net lease investor and leased back under a long-term NNN structure, allowing the owner to continue operating the store. For example, a property acquired at $2.0 million that can support $350,000 of annual rent would be valued at roughly $4.67 million at a 7.5% cap rate.
However, investors will look beyond the stated cap rate. Because sale-leaseback rent is negotiated between the parties, a higher rent does not automatically translate into greater value. Buyers will also evaluate whether the business can comfortably support the lease obligation. Rent-to-EBITDAR coverage below roughly 1.5x can raise concerns that the rent, rather than the strength of the operating business, is supporting the valuation. For an owner considering this strategy, establishing sustainable rent can therefore be just as important as maximizing the initial rent figure