California Multifamily Trends
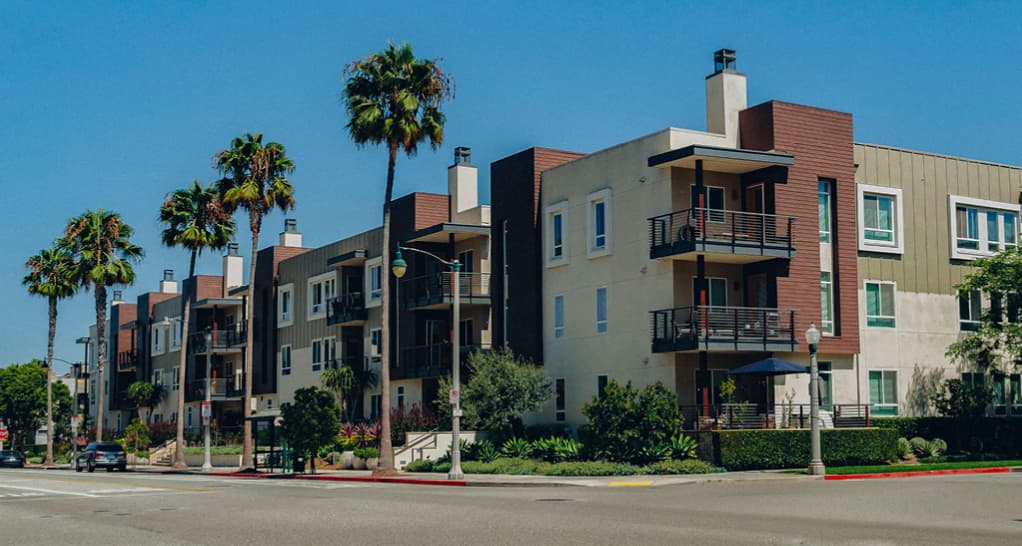
California’s major multifamily markets (Los Angeles, Orange County, San Diego, San Francisco) are moving in increasingly different directions, even as vacancy remains relatively tight across all four. Despite persistent narratives around population outmigration from California, multifamily fundamentals suggest the impact on apartment owners has been far from disruptive. For owners, operators, and investors, the result is a California multifamily market that increasingly requires a market-by-market approach. The broader story is less about a statewide retreat in renter demand and more about how local supply, affordability, and development dynamics are shaping performance from one market to the next.
What the numbers say:
Los Angeles: Continues to deliver new supply at a pace few major U.S. markets currently match, while maintaining relatively stable occupancy.
San Diego: Vacancy remains steady as the market absorbs its largest wave of new deliveries in roughly 25 years.
Orange County: Continues to benefit from longstanding land and development constraints, even as its construction pipeline reaches a decade high.
San Francisco: Stands apart with very limited new supply entering the market as renter demand strengthens, contributing to double-digit rent growth.
The State of Play
| Market | Vacancy | TTM Completions | Under Construction |
Avg. Rent | Rent Growth YoY | Cap Rate | TTM Volume |
| Los Angeles | 4.5% | 9,105 | 18,066 | $2,887 | +0.8% | 5.37% | $9.3B (+35%) |
| Orange County | 3.6% | 2,579 | 3,693 | $2,886 | +1.7% | 4.72% | $1.4B (-10%) |
| San Diego | 3.8% | 6,793 | 7,928 | $2,764 | +0.4% | 4.89% | $2.5B (-32%) |
| San Francisco | 3.8% | 676 | 3,908 | $3,562 | +11.8% | 4.82% | $3.6B (+8%) |
Los Angeles: Supply Growth Meets Steady Demand
Vacancy: 4.5% (Q2 2026), up 38 bps year-over-year
Trailing-Twelve-Month Completions: 9,105 units, up 17.6% year-over-year
Rent / Growth: $2,887, up 0.8% year-over-year
Transaction Volume: $9.3B trailing-twelve-month, up 35.2% year-over-year
Los Angeles is still seeing elevated levels of new supply, even as development activity slows across many other major U.S. markets. Q2 completions increased 11.8% year-over-year, and current delivery schedules point to another historically active year for new multifamily supply.
Demand continues to support that growth. Net absorption reached 2,837 units during the quarter, moderating from last year but remaining strong enough to keep pace with new deliveries. Occupied inventory increased to 1.12 million units, giving Los Angeles the largest occupied multifamily base in the country.
Transaction volume has also strengthened. Trailing-twelve-month transaction volume increased 35.2%, while Q2 transaction volume reached $2.56 billion, the strongest quarter in this data set.
At the same time, pricing continues to adjust. Cap rates have increased for six consecutive quarters to 5.37%, and price per unit remains 13.9% below its 2022 peak. The increase suggests buyers and sellers are reaching greater alignment on pricing and returns under current financing conditions.
Development remains concentrated in several submarkets. South Bay, Palms/Mar Vista, and Long Beach lead construction as a share of existing inventory. South Central and Southeast Los Angeles are posting the strongest rent growth, while Downtown Los Angeles and South Central continue to record the highest vacancy rates.
Orange County: Limited Supply, Growing Pipeline
Vacancy: 3.6% (Q2 2026), up 30 bps year-over-year
Trailing-Twelve-Month Completions: 2,579 units, down 9.5% year-over-year
Rent / Growth: $2,886, up 1.7% year-over-year
Transaction Volume: $1.4B trailing-twelve-month, down 10.4% year-over-year
Orange County remains one of California’s most supply-constrained multifamily markets, but its development pipeline is expanding.
Units under construction have increased to 10,260, equal to 3.73% of existing inventory and the highest share since 2016. Much of that development is concentrated in a limited number of large projects, particularly in Irvine.
The increase is meaningful for a market that has historically delivered fewer than 5,000 units annually. Based on the current pipeline, 2026 deliveries are positioned to exceed 2025 levels, making Orange County one of the relatively few major markets where annual deliveries are still increasing.
Market fundamentals remain tight. Vacancy stands at 3.6%, below many faster-growing Sunbelt markets. Rent growth has moderated to 1.7% from 2.9% a year ago as new supply creates more options for renters, but net absorption of 1,227 units indicates that demand continues to support the additional inventory.
Transaction volume has slowed following a strong comparison period. Trailing-twelve-month transaction volume declined 10.4%, while Q2 transaction volume fell sharply from the prior-year quarter.
Pricing has been more resilient. The market’s 4.72% cap rate remains among the lowest across California, while price per unit is 6.0% below its 2022 peak. That relatively modest decline is consistent with continued investor interest in Orange County’s long-term supply constraints and demand fundamentals.
San Diego: Record Supply Meets Strong Absorption
Vacancy: 3.8% (Q2 2026), down year-over-year
Trailing-Twelve-Month Completions: 6,793 units, up 57.8% year-over-year
Rent / Growth: $2,764, up 0.4% year-over-year
Transaction Volume: $2.5B trailing-twelve-month, down 31.9% year-over-year
San Diego is working through its highest level of multifamily deliveries in roughly 25 years, and demand has largely kept pace.
Developers completed 2,330 units during Q2, more than four times the 509 units delivered a year earlier. Trailing-twelve-month completions increased 57.8% to 6,793 units.
Despite that increase, vacancy has remained stable. Net absorption reached 3,570 units, up 185.1% year-over-year and nearly three times the prior-year level. That demand helped vacancy decline from Q1 even as new units entered the market.
The construction pipeline also indicates that supply pressure may begin to moderate. Units under construction have declined to 9,950, representing 2.95% of inventory compared with a 4.00% peak in Q2 2024.
Rent growth remains modest at 0.4% following the rapid gains recorded in 2021 and 2022. Transaction volume has also slowed, with trailing-twelve-month transaction volume down 31.9% and Q2 transaction volume down 24% year-over-year.
Pricing has remained comparatively stable despite lower transaction volume. Cap rates increased modestly to 4.89%, while price per unit remains approximately 5.4% below its 2022 peak.
For investors, San Diego’s near-term performance will depend largely on how quickly the market works through its current supply cycle and whether absorption remains strong as deliveries continue.
San Francisco: Limited Supply Supports Rent Growth
Vacancy: 3.78% (Q2 2026), down 97 bps year-over-year
Trailing-Twelve-Month Completions: 676 units, down 57.4% year-over-year
Rent / Growth: $3,562, up 11.8% year-over-year
Transaction Volume: $3.6B trailing-twelve-month, up 8.0% year-over-year
San Francisco currently has the strongest rent growth of the four California markets, supported by improving renter demand and a limited development pipeline.
The market recorded no completions in either of the past two quarters, while trailing-twelve-month deliveries declined 57.4% to 676 units. Roughly 20,000 entitled units remain stalled as construction costs, financing conditions, and project economics continue to limit new development.
At the same time, hiring within the AI and technology sectors has strengthened demand from higher-income renters. Average rent increased 11.8% year-over-year to $3,562.
Net absorption totaled 197 units. While modest in absolute terms, limited new supply allowed that demand to push vacancy down 97 basis points to 3.78%, its tightest level in 25 years.
Transaction volume has responded to the improvement in fundamentals. Trailing-twelve-month transaction volume increased 8.0% to $3.6 billion, while Q2 transaction volume rose 74.7% year-over-year to $1.5 billion.
Cap rates have increased to 4.82%, their highest level since 2011, reflecting a higher cost-of-capital environment even as operating fundamentals improve.
Performance is especially strong in several technology-oriented submarkets. SoMa recorded 33.0% year-over-year rent growth, while Mission Bay/China Basin/Potrero Hill reached 25.6%. Both substantially outpaced the citywide average.
Key Themes Across California
Several trends are shaping California multifamily performance in 2026.
Supply remains the key differentiator. Los Angeles, Orange County, and San Diego continue to absorb elevated construction pipelines, while San Francisco has added very little new inventory. With new supply exceptionally limited as renter demand strengthens, San Francisco has seen double-digit rent growth, sharply outpacing the other Southern California markets.
Transaction volume is diverging by market. Los Angeles has the highest transaction volume among the markets, maintaining relatively strong liquidity despite modest rent growth. San Francisco is seeing stronger transaction activity alongside rapid rent growth, while San Diego has posted strong absorption despite lower transaction volume.
Pricing continues to adjust unevenly. Cap rates have expanded most notably in Los Angeles, while movement has been more limited in Orange County and San Diego. San Francisco’s cap rate has also risen despite strong operating fundamentals, underscoring the continued influence of capital costs.
Development constraints remain important. Orange County continues to face longstanding land and development constraints, even as its pipeline expands, particularly in Irvine. San Francisco similarly faces feasibility challenges that continue to limit new construction.