Dallas-Fort Worth, TX Industrial Market Report Q1 2026

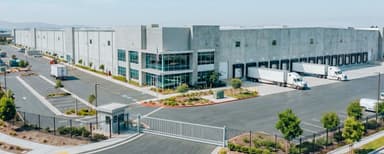
Dallas-Fort Worth’s industrial market fundamentals showed improvement in Q1 2026, with 9.4 million square feet of net absorption helping to offset recent deliveries and stabilize vacancy at 8.7%. Asking rents averaged $10.24 per square foot, with annual growth of 3.8%, reflecting continued but moderating pricing power. Demand remains strongest in bulk logistics space, where large users continue to drive leasing activity. Outer submarkets with modern inventory have captured the majority of this demand, particularly for buildings exceeding 500,000 square feet. Vacancy in large-format product has begun to compress as available supply is absorbed. Smaller-bay and shallow-bay properties have experienced softer demand and less consistent absorption. Concessions and sublease availability continue to influence leasing dynamics. Overall, the market is moving toward continued balance as demand catches up with elevated supply levels.
Key Findings
- Fundamentals improved during the quarter as strong tenant demand continued to work through recent supply additions and pushed market conditions in a healthier direction.
- Leasing momentum remained concentrated in large-format logistics product, especially in outer submarkets where modern bulk space and land availability continue to attract major users.
- Capital markets stayed active despite a more selective underwriting environment, with investors favoring well-leased assets and long-term income durability over lease-up risk.
Dallas-Fort Worth Industrial Supply & Demand Dynamics
Source: CoStar Group, Inc.
Dallas-Fort Worth Demographics
Source: CoStar Group, Inc.
- Unemployment Rate: 4.1%
- Current Population: 8,482,426
- Households: 3,078,156
- Median Household Income: $95,607
Dallas-Fort Worth continues to benefit from one of the strongest economic profiles in the U.S., supported by sustained population growth, in-migration, and a diverse industry base. The region’s expanding population and household formation trends continue to drive demand for logistics and distribution space. A broad mix of industries, including transportation, manufacturing, financial services, and professional services, supports employment stability and industrial demand. The metro’s central location and extensive infrastructure network reinforce its role as a national distribution hub. Major corporate relocations and expansions continue to add to job growth and economic resilience. Fort Worth’s concentration in logistics, aerospace, and defense further strengthens industrial demand drivers. While overall growth has moderated, underlying economic fundamentals remain supportive of continued occupancy gains.
Dallas-Fort Worth’s economy ranks among the most dynamic in the nation.
Source: CoStar Group, Inc.
Population, Labor Force, & Income Growth
Source: CoStar Group, Inc.
Dallas-Fort Worth Industrial Construction
Development activity remains elevated, with 39.2 million square feet under construction and 6.2 million square feet delivered during the quarter. While still above historical norms, the pipeline reflects a more measured pace compared to the peak development cycle. Construction remains concentrated in bulk logistics product, particularly in westward and outer submarkets with available land. Developers continue to prioritize modern specifications, including higher clear heights and larger building footprints. A significant portion of the pipeline remains speculative, requiring continued leasing momentum to maintain balance. Overall, supply remains a key factor, but improving demand is helping to mitigate near-term pressure.
SF Construction Starts
Source: CoStar Group, Inc.
SF Under Construction
Source: CoStar Group, Inc.
Dallas-Fort Worth Industrial Sales
Investment activity remained steady in Q1 2026, with $369 million in sales volume and average pricing of $147 per square foot. Cap rates averaged 6.2%, reflecting a more normalized pricing environment compared to prior cycle lows. Buyers are increasingly focused on stabilized assets with durable income streams and limited lease-up risk. Institutional capital has become more active, particularly in larger logistics transactions. Elevated vacancy in some newer assets has created pricing challenges for value-add opportunities. As a result, investors are prioritizing assets with strong occupancy and long-term leases. Lending conditions have improved modestly, supporting transaction activity. Overall, the capital markets environment is active but disciplined, with continued confidence in Dallas-Fort Worth’s long-term industrial fundamentals.
Sales Volume
Source: CoStar Group, Inc.
By the Numbers
Q1 2026 | Source: CoStar Group, Inc.
- Sales Volume: $369M
- Price Per SF: $147
- Cap Rate: 6.2%
- Vacancy Rate: 8.7%
- Rent Growth: 3.8%
- Asking Rent Per SF: $10.24
- SF Under Construction: 39.2M
- SF Delivered: 6.2M
- SF Absorbed: 9.4M