
Dallas-Fort Worth, TX Multifamily Market Report Q2 2026
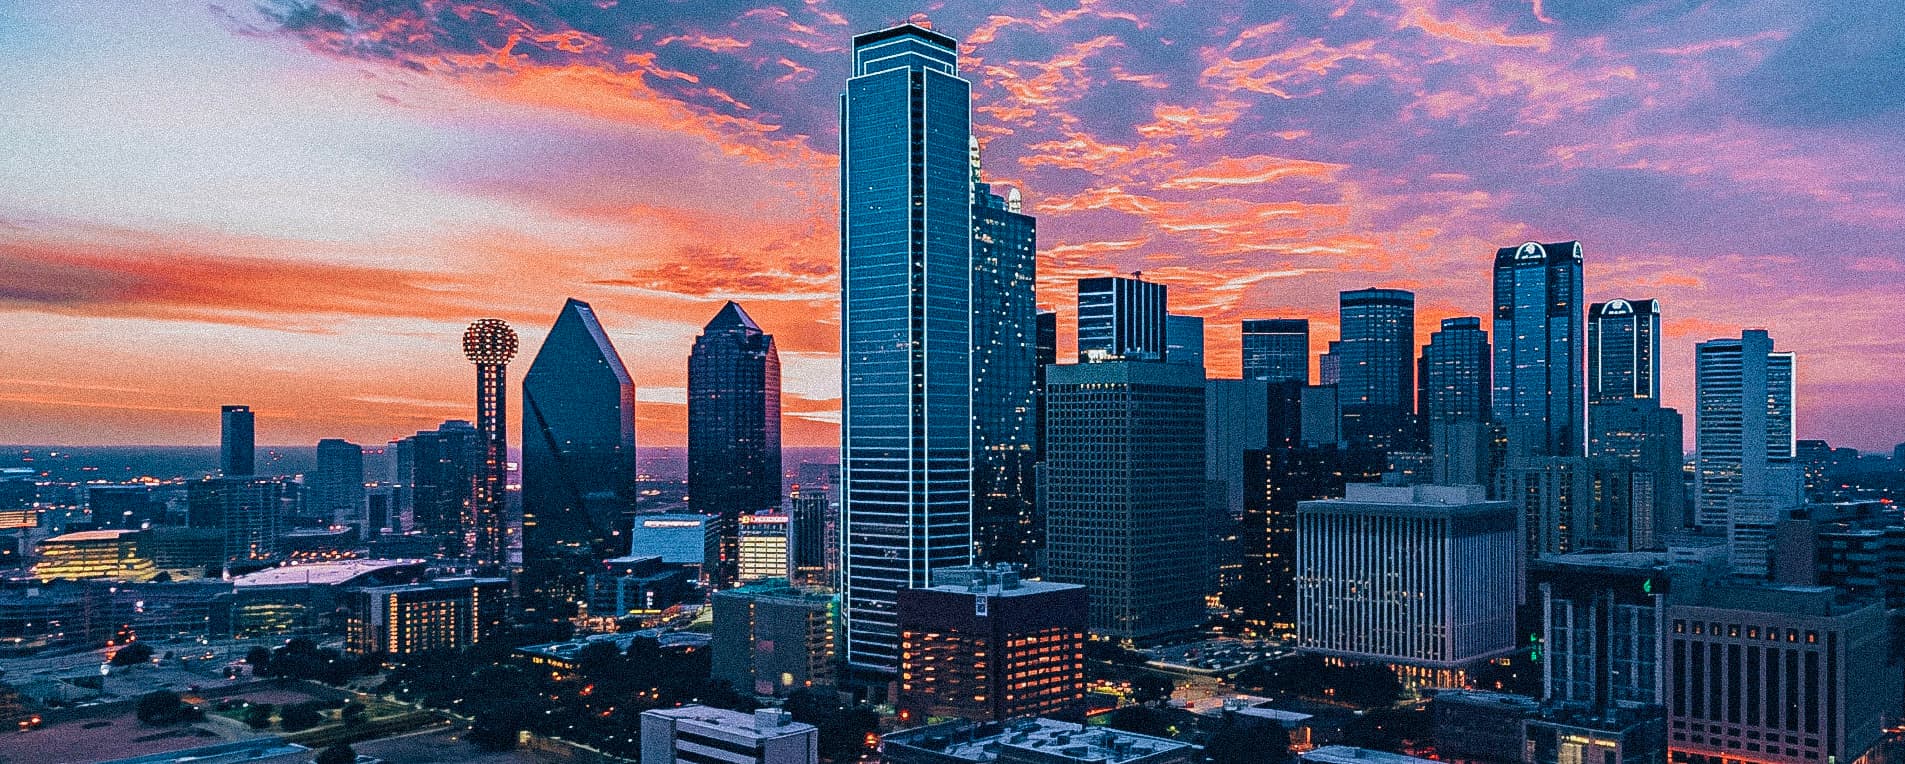
Vacancy widens 35 bps to 6.2% while rent growth turns negative at -1.0%

Demand
Vacancy rose to 6.21% in Q2, up 35 bps YoY, though it improved from 6.84% in Q1, with net absorption of 12,180 units. This is one of the largest quarterly totals in the country, a result of continued progress through the backlog left by 2024’s record supply wave. Rent fell to $1,480, down 1.0% YoY, a modest improvement from the -1.17% decline a year ago. Occupied stock grew to 940,880 units, up 2.4% YoY, in a market of more than a million units. With absorption running consistently strong and completions now falling fast, DFW looks to be working through the tail end of its supply digestion.
Supply
DFW delivered 6,238 units in Q2, down 24.4% YoY, and TTM completions fell 23.6% to 27,748 units, down from an extraordinary 42,309 delivered in 2024, one of the largest single-year supply totals of any market. Units under construction fell to 43,320, just 4.32% of inventory and well below the 8.54% peak reached in Q1 2023, so the pipeline behind that record year keeps draining steadily. Even after that pullback, DFW’s remaining pipeline is larger in absolute terms than most other markets’ entire construction activity, a reminder of the sheer scale this market operates at.
Investment Market
Investment activity has cooled. TTM fell 25.2% YoY to $9.1B but remains one of the largest dollar totals in the nation. Q2 is down 40.6% YoY to $1.07B. Cap rates have held steady near 5.65%, while price per unit eased to $171,198, down 11.3% from the 2022 peak of $193,061.
Volume
- $9.1B TTM volume (-25% YoY)
- Q2 2026: $1701M
- Series peak $31.7B (2021)
Pricing
- Q2 cap rate 5.65%
- Q2 price per unit $171k
- Caps expanding 18 quarters running


