
AuthorChristian Becker
Associate Vice PresidentAustin, TX

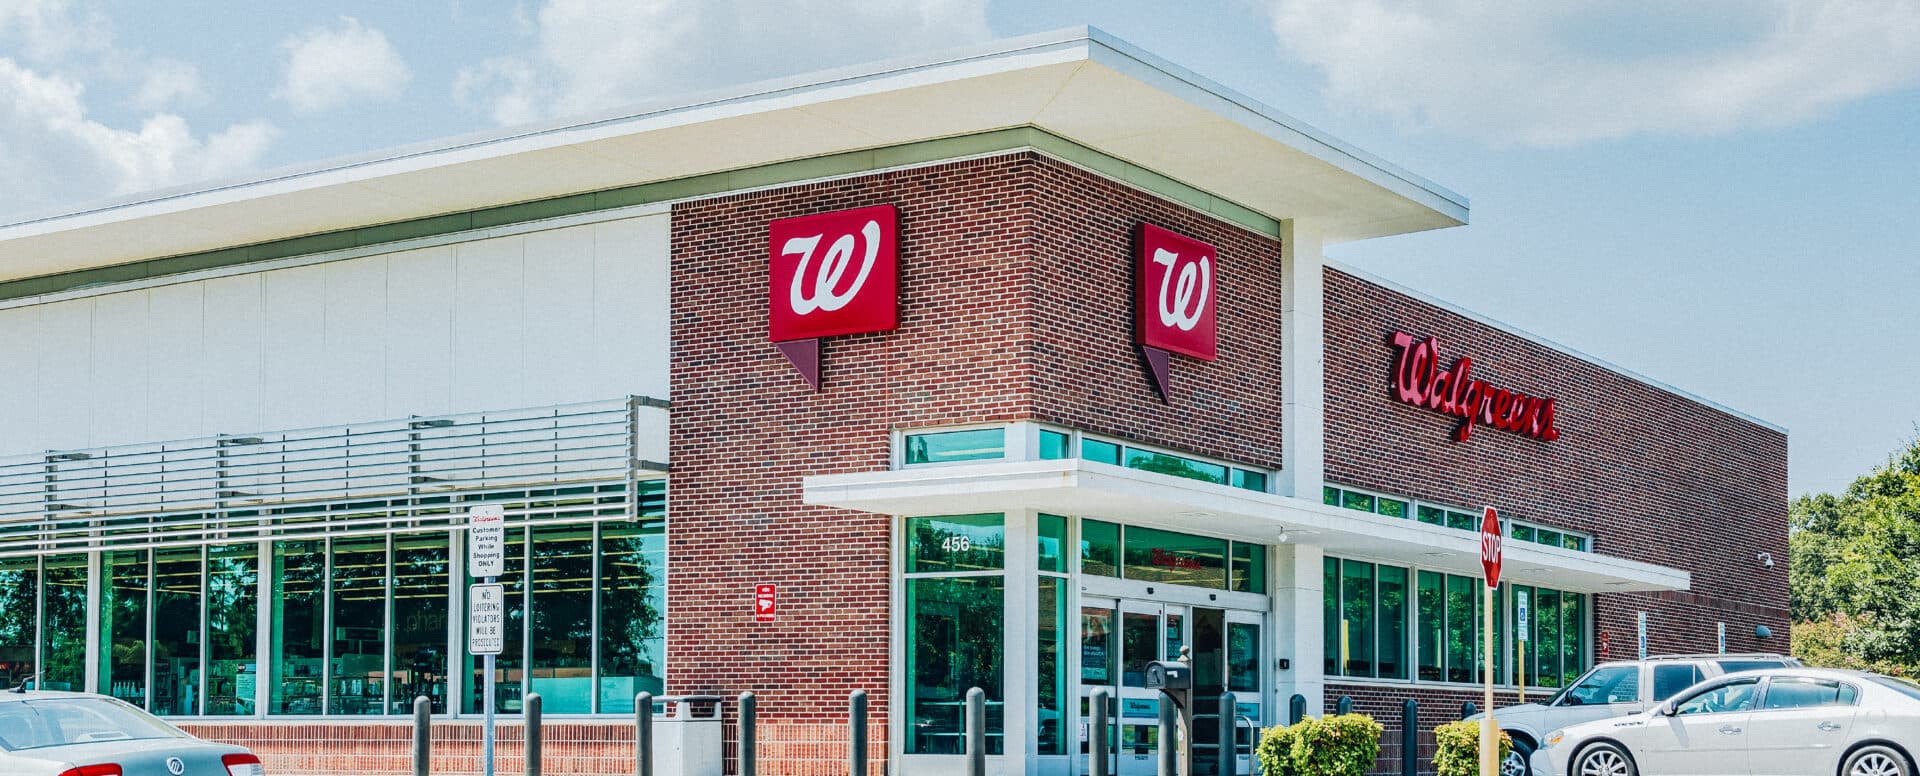
A guide to interpreting Walgreens sales reports, understanding what the RX column really means, and why third-party card data shows a dramatically higher figure than reported store sales.

If you own a Walgreens, you’ve almost certainly received an annual sales statement showing a reported gross sales figure that looks too low for a pharmacy doing hundreds of thousands of transactions a year. It’s easy to assume the number is correct and move on because the lease requires no percentage rent payment and there’s nothing obvious to dispute.
The reason comes down to one clause buried in nearly every Walgreens lease executed before 2018, when the company effectively stopped building new traditional-format stores that report sales. The handful of traditional stores built since, along with the 500-plus leases Walgreens has recast since 2019, have abandoned sales reporting entirely from our research.
Walgreens breaks down its annual sales reporting into three line items. Below is a breakdown of each category alongside a recent example from an Ohio Walgreens in a small-town submarket, a traditional format store (14,820 SF) built in 2005.
| Category | What It Captures | Ex: Ohio 2025 |
|---|---|---|
| Merchandise | Front-end retail: OTC medicine, beauty, household, seasonal | $1,291,039 |
| Conv FD | Convenience food and beverages sold in-store | $159,503 |
| RX | Net pharmacy adjustments after PBM reconciliations | ($7,108) |
| Total Reported | The figure used for percentage rent calculation | $1,443,434 |
The RX column is not a gross pharmacy sales figure at all. It is the residual net of out-of-pocket pharmacy transactions after PBM chargebacks, insurance adjustments, and reimbursement reconciliations are applied. At most stores, it represents a trivial share of reported revenue. At a growing number of stores including the Ohio example above, it is negative, meaning the pharmacy department’s “reported sales” are technically less than zero.
This is the standard percentage rent language Walgreens has used across its national leasing program for at least two decades. To confirm this, we reviewed nearly 30 independently executed Walgreens leases spanning multiple states and unrelated landlords, dated between 1995 and 2012 — the tail end of Walgreens’ new-store construction era, which effectively ended in 2018. Every lease in the sample contains the same Article 2(b)-(c) Gross Sales and Third Party Prescription Plan exclusion language. Walgreens’ more recent “recast” leases, executed as extensions on existing stores, have moved away from this structure entirely, in almost every case eliminating sales reporting requirements altogether:
“The following shall be specifically excluded from Gross Sales: receipts from the sale of prescription items pursuant to Third Party Prescription Plans, as defined below…” “’Third Party Prescription Plans’ shall be deemed to be those health benefit plans wherein all or any portion of the cost of pharmaceuticals and any other items obtained by a prescription are paid or reimbursed by an organization such as a governmental agency, an entity created by state or federal law, an insurance carrier, a health maintenance organization, a union, a trust or benefit organization or an employer…” – Walgreens Standard Lease, Article 2(b)-(c)
This definition is intentionally broad. Medicare Part D, Medicaid, commercial insurance, employer health plans, HMOs — every major pharmacy payment channel falls within it. The lease then sets percentage rent rates of 2.0% on merchandise and only 0.5% on food items and prescription items — but the exclusion of third-party plans means virtually no prescription revenue reaches that 0.5% bucket in the first place.
The practical result: Walgreens legally discloses only the narrow slice of pharmacy revenue not covered by insurance or PBM programs, which in today’s environment represents a negligible share of pharmacy volume. This structure has been embedded in Walgreens leases for decades and was negotiated as standard practice when long-term NNN deals were signed.
Applying company-wide pharmacy mix data to the Ohio store example reveals the magnitude of what is hidden. According to Walgreens’ own Fiscal 2024 Form 10-K, pharmacy sales represent 77% of total U.S. segment revenue, with retail (front-end) accounting for only 23%. That same filing confirms that 97% of pharmacy sales involve reimbursement from managed care organizations, governmental agencies, PBMs, or private insurance — the exact payment channels the lease excludes from Gross Sales reporting entirely.
Under that framework, the $1.44M in reported sales represents roughly the 23% front-end slice of actual store revenue. A back-calculation suggests implied total revenue closer to $6.3M — not the $4.32M we might have estimated using the older industry standard 3x multiplier for estimating total sales.
However, this is where the analysis must be handled carefully, and why a confident single revenue estimate is misleading. Walgreens own former CEO Tim Wentworth stated during the company’s Q2 2024 earnings call that, “We are at a point where the current pharmacy model is unsustainable”, largely due to PBM reimbursement rates falling below the pharmacy’s cost of dispensing.
When Walgreens fills a prescription at a loss, the ‘revenue’ from that transaction is real, but the net contribution to store economics is negative. CenterCheck captures the transaction; it cannot see the margin destruction underneath it.
This reality complicates any attempt to reverse-engineer total store revenue from reported figures, and this problem is not static. Walgreens’ own 10-K filings reveal a decade-long trend of pharmacy’s share of total revenue growing from 63% in fiscal 2013 to 77% in fiscal 2024, while front-end retail has shrunk from 37% to 23% over the same period. Third-party reimbursement as a share of pharmacy sales has simultaneously crept from 96.8% to 97%. The practical consequence: landlords relying on the annual sales report are receiving a disclosure that represents an ever-shrinking fraction of actual store activity — not because of any change in the lease language, but because Walgreens’ own business mix has shifted steadily toward the revenue category the lease excludes.
This is precisely why no single revenue figure is more honest than a range. Gross pharmacy revenue may be in the $2.5M-$3M range at a store like the Ohio example. Net pharmacy economics — after PBM reimbursements, drug costs, and dispensing overhead — may produce far less economic value than the revenue line suggests, and in some prescription categories may actually reduce profitability. The pharmacy is simultaneously the store’s largest revenue driver and, in the current environment, its most economically stressed department.
CenterCheck reported $7,896,044 in card sales for this Ohio Walgreens in 2025, nearly 5.5x the reported lease figure. Understanding the discrepancy requires knowing what CenterCheck actually measures.
CenterCheck processes anonymized credit and debit card transaction data, then builds what it calls a “full record” by combining directly captured transactions with a modeled estimate for card volume it does not directly observe. When a customer pays for a prescription with a Visa debit card, an HSA card, or a Mastercard — even if that transaction is ultimately reimbursed by insurance — the card swipe itself is captured. CenterCheck sees the consumer-facing transaction amount, not the net reimbursement Walgreens ultimately receives.
Several factors explain why the $7.9M card figure can exceed a simple gross revenue estimate:
The short version: CenterCheck measures modeled consumer card activity, not net pharmacy economics. It is an excellent directional indicator of store traffic, customer volume, and retail health. It is not a proxy for Walgreens’ net retained revenue after PBM clawbacks, and because it excludes cash, it likely understates true total store sales rather than overstating them.
Rather than treating any single figure as definitive, sophisticated investors and brokers should triangulate across all three data sources:
| Data Source | What It Tells You | What It Does Not Tell You |
|---|---|---|
| Walgreens Sales Report ($1.44M) | Front-end retail performance only; the contractually-defined lease reporting figure | Pharmacy volume, PBM revenue, or true store economics |
| Back-Calculated Gross Revenue (~$3.5M–$4.5M) | Implied total store revenue based on known pharmacy/front-end mix ratios | Net margin; excludes PBM losses on below-cost Rx fills |
| CenterCheck Card Sales ($7.9M) | Consumer-facing card transaction volume; best proxy for traffic and customer engagement | Net retained revenue; inflated by high-cost Rx swipes before PBM netting |
For this specific Ohio store example, the CenterCheck data is actually more useful than the revenue estimate as a closure-risk indicator. The store generated 131,808 unique customers and 192,584 card transactions in 2025, growing 29.6% and 21.6% year-over-year respectively. A store closing does not look like this. The customer engagement data tells a fundamentally different story than the $1.44M lease report.
For anyone transacting on a Walgreens net lease property, the implications are direct:
From our experience, percentage rent clauses in Walgreens leases are rarely achieved. The Third-Party Prescription Plan exclusion means that even a high-volume pharmacy store will rarely, if ever, trigger percentage rent above the fixed rent floor.
Investors have operated for years with an incomplete picture of how the sales reporting works — and in many cases have made leasing, acquisition, and disposition decisions based on that incomplete picture. Understanding the lease language, the PBM economics, and the limitations of third-party card data is the foundation of a defensible investment thesis on drugstore real estate.