
Los Angeles, CA Multifamily Market Report Q2 2026
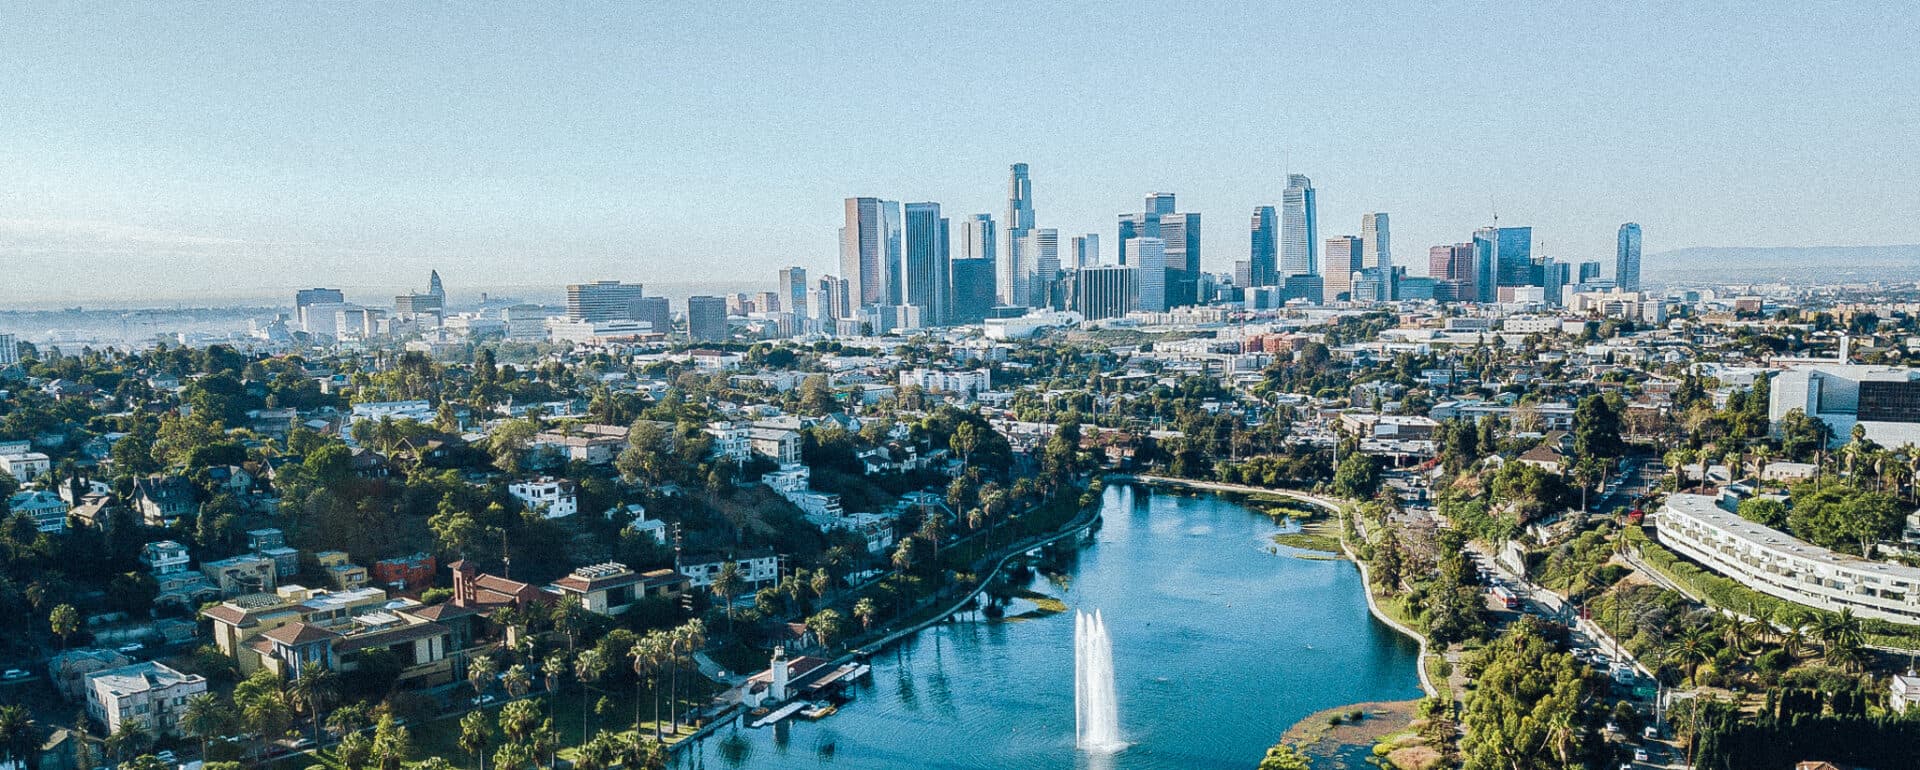
Los Angeles is doing something almost no other major apartment market is doing right now: it is building more. Multifamily completions in the metro rose 11.8% year-over-year in the second quarter of 2026, and the trailing 12-month total climbed 17.6% to 9,105 units, putting Los Angeles on pace for its largest calendar-year delivery total since record-keeping began in 2000. Even with that supply wave, vacancy held below 5% at 4.52%, effective rent grew 0.80% year-over-year to $2,887, and occupied stock reached 1.12 million units, the largest apartment base in the country. For a market absorbing this much new product, holding the line on vacancy and keeping rent growth positive is a quieter kind of resilience than a dramatic turnaround story.
Key Findings
- Los Angeles is building through a cycle where most markets have stopped: Trailing 12-month completions rose 17.6% to 9,105 units, with 2026 tracking as the metro’s biggest delivery year since 2000.
- Demand is keeping pace with near-record supply: Net absorption reached 2,837 units in Q2 2026, cooler than last year but enough to hold vacancy at 4.52%, up just 38 basis points year-over-year.
- Rent growth stayed positive and is forecast to accelerate: Effective rent rose 0.80% to $2,887, with year-end 2026 forecasts calling for $2,904 and 1.7% growth.
- Investment activity surged: More than $9.3B traded over the trailing 12 months, up 35.2% year-over-year, including $2.56B in Q2 2026 alone (+39.3% YoY).
- Buyers are underwriting higher-for-longer: Cap rates have risen for six consecutive quarters to 5.37% while price per unit slipped to $308,551, roughly 13.9% below the 2022 peak.
Market Overview
Los Angeles entered the second half of 2026 with the largest occupied apartment base in the United States at 1.12 million units. Vacancy rose to 4.52%, up 38 basis points from a year earlier, as net absorption of 2,837 units cooled from last year’s pace but still tracked a market delivering more product, not less. Forecasts call for vacancy to tighten modestly to 4.4% by year-end as the current construction pipeline is absorbed. For comparison with the metro’s prior quarter, see the Los Angeles Multifamily Market Report Q1 2026.
Los Angeles Multifamily Rents
Effective rent in Los Angeles reached $2,887 in Q2 2026, up 0.80% year-over-year. Forecasts call for rent to reach $2,904 by the end of 2026, with annual rent growth accelerating to 1.7%.
Rent Growth by Submarket
Rent growth was concentrated in the metro’s more affordable, supply-constrained submarkets. South Central led all Los Angeles submarkets at +5.5% year-over-year, followed by Southeast Los Angeles at +3.7% and Long Beach at +2.7%. Higher-supply and higher-price submarkets lagged: Burbank/Glendale/Pasadena (-1.5%), Woodland Hills (-1.3%), and San Gabriel Valley (-1.2%) all posted year-over-year declines.
Los Angeles Multifamily Vacancy
Vacancy Rate
Vacancy in Los Angeles measured 4.52% in Q2 2026, an increase of 38 basis points year-over-year, and is forecast to end 2026 at 4.4%. Holding vacancy under 5% while delivering more than 9,000 units over 12 months is the clearest signal of underlying demand strength in the metro.
East Los Angeles posted the tightest vacancy in the metro at 3.2%, followed by South Bay at 3.5% and San Gabriel Valley and Long Beach at 3.9% each. Downtown Los Angeles (5.8%) and South Central (5.6%) carried the highest vacancy, reflecting concentrated recent deliveries.
Los Angeles Multifamily Construction
Units Delivered and Under Construction
Q2 2026 completions rose 11.8% year-over-year to 1,695 units, and trailing 12-month completions climbed 17.6% to 9,105 units. Multiple industry trackers expect 2026 completions to be the largest calendar-year total in Los Angeles since record-keeping began in 2000. Completions are forecast to moderate to roughly 7,280 units by year-end 2026 on a trailing basis.
Construction by Submarket
Measured as a share of existing inventory, South Bay leads Los Angeles construction activity at 3.9% of inventory under construction, followed by Palms/Mar Vista at 3.3% and Long Beach at 3.0%. Woodland Hills (2.6%), Mid-Wilshire (2.6%), and Downtown Los Angeles (2.5%) round out the most active submarkets. San Gabriel Valley has effectively no new supply underway at 0.0% of inventory.
Los Angeles Multifamily Investment Market
Sales Volume and Pricing
Investors are responding to the supply story rather than shying away from it. More than $9.3B in Los Angeles multifamily assets traded over the trailing 12 months, up 35.2% year-over-year, with Q2 2026 volume of $2.56B up 39.3% from the same quarter last year. For context, the series peak was $13.0B in 2022.
Cap rates have risen for six straight quarters to 5.37%, while price per unit has drifted down over the same stretch to $308,551, about 13.9% below the 2022 peak. That combination of rising transaction volume against a still-repricing market suggests buyers are underwriting a higher-for-longer rate environment rather than betting on compressed yields. For a view of the metro’s other property types, read the Los Angeles Retail Market Report Q2 2026.
By the Numbers
Q2 2026 | Sources: Matthews™, RealPage, BLS
- Vacancy Rate: 4.5% (forecast EOY 4.4%)
- Average Effective Rent: $2,887 (forecast EOY $2,904)
- Rent Growth: +0.8% YoY (forecast EOY +1.7%)
- Net Absorption: 2,837 units
- Completions (TTM): 9,105 units (forecast EOY 7,280)
- Q2 2026 Completions: 1,695 units (+11.8% YoY)
- Occupied Stock: 1.12 million units
- Sales Volume (TTM): $9.3B (+35.2% YoY)
- Q2 2026 Sales Volume: $2.56B (+39.3% YoY)
- Average Cap Rate: 5.37%
- Price Per Unit: $308,551
Frequently Asked Questions
What is the multifamily vacancy rate in Los Angeles?
The Los Angeles multifamily vacancy rate was 4.52% in Q2 2026, up 38 basis points year-over-year, and is forecast to end 2026 at 4.4%.
What is the average apartment rent in Los Angeles?
Average effective apartment rent in Los Angeles was $2,887 in Q2 2026, up 0.80% year-over-year, with a year-end 2026 forecast of $2,904.
How much new apartment construction is happening in Los Angeles?
Los Angeles delivered 1,695 apartment units in Q2 2026 and 9,105 units over the trailing 12 months, a 17.6% year-over-year increase. 2026 is on pace to be the largest calendar-year delivery total in Los Angeles since 2000.
What are Los Angeles multifamily cap rates in 2026?
The average Los Angeles multifamily cap rate was 5.37% in Q2 2026, the sixth consecutive quarterly increase, with an average price per unit of $308,551.
Which Los Angeles submarkets have the strongest rent growth?
South Central led Los Angeles submarkets with +5.5% year-over-year rent growth in Q2 2026, followed by Southeast Los Angeles (+3.7%) and Long Beach (+2.7%).
To discuss Los Angeles multifamily investment opportunities, connect with Erik Vogelzang, Market Leader – Los Angeles.


