
Orange County, CA Industrial Market Report Q2 2026
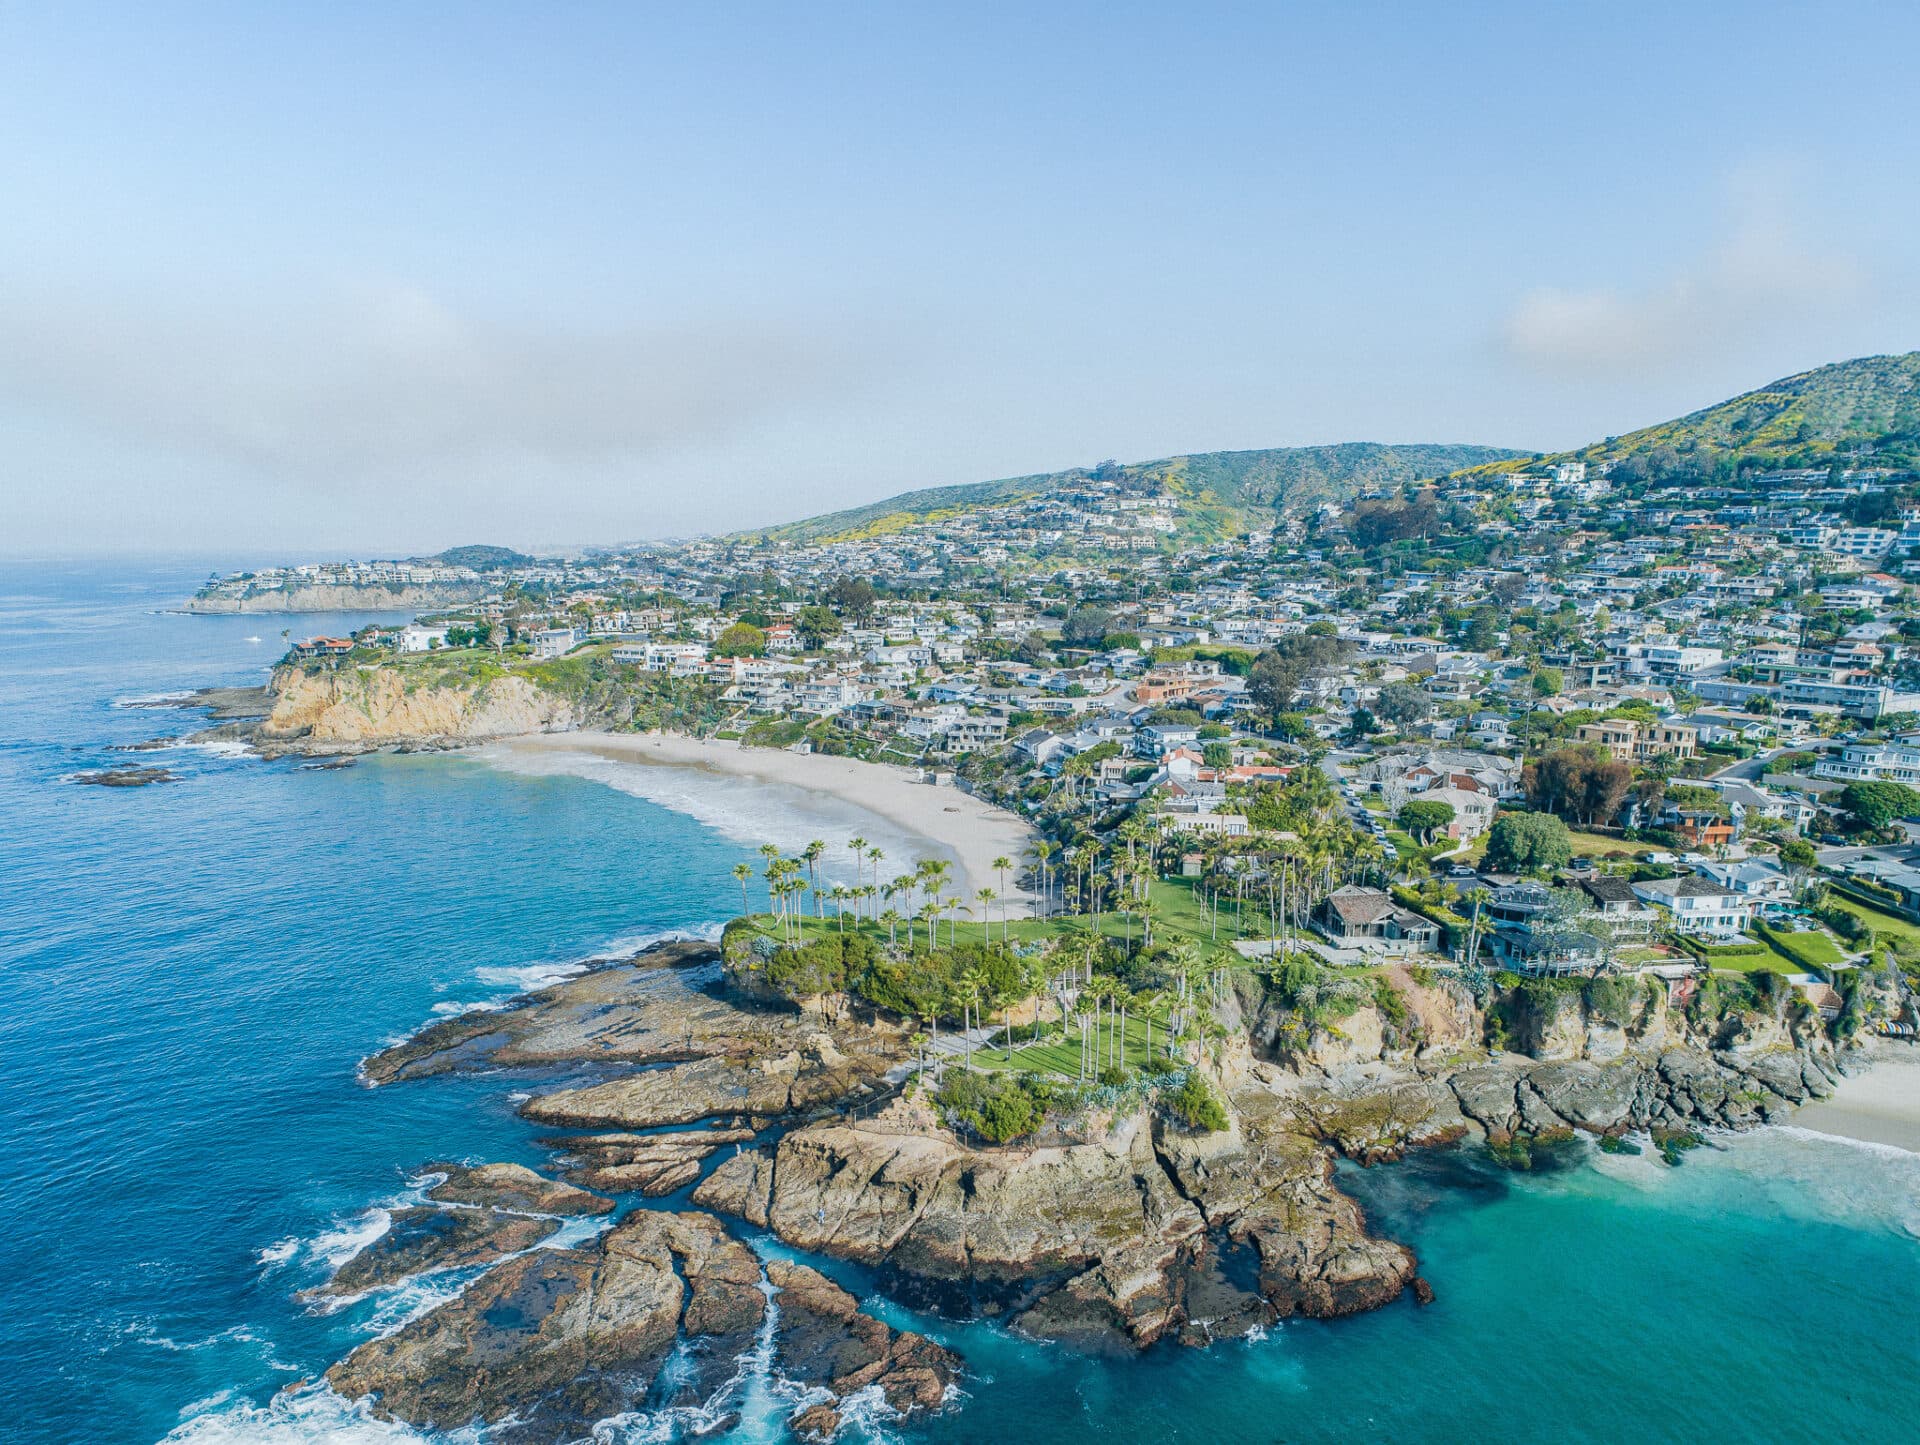
Orange County’s industrial market offered tenants greater flexibility in the second quarter, with vacancy at 6.5% and net absorption totaling negative 189,000 square feet. Although leasing activity improved, demand was not yet strong enough to offset recent move-outs and available inventory. Asking rents averaged $19.39 per square foot, down 0.4% year-over-year, as landlords adjusted pricing and offered concessions to attract tenants. Performance varied by property size, with smaller industrial buildings outperforming larger distribution facilities, where availability was more elevated. Still, improving leasing momentum and a limited construction pipeline slowed the pace of softening, positioning the market for gradual stabilization as excess space is absorbed.
Key Findings
- Demand remained insufficient to offset new supply, resulting in negative net absorption and a modest increase in vacancy.
- The development pipeline is shrinking to one of its lowest levels in years, positioning the market for improved fundamentals.
- Orange County continued to attract capital due to its supply-constrained industrial inventory and long-term rent growth potential.
Orange County Industrial Supply & Demand Dynamics
Source: CoStar Group, Inc.
Orange County Demographics
Source: CoStar Group, Inc.
- Unemployment Rate: 4.4%
- Current Population: 3,147,179
- Households: 1,096,794
- Median Household Income: $119,860
Top Orange County Tenants by SF
Source: CoStar Group, Inc.
- Houdini, Inc.
- Harbor Distributing
- Robinson Pharma, Inc.
- Anduril
Population, Labor, and Income Growth
Source: CoStar Group, Inc.
Orange County Industrial Construction
Development activity moderated as only 721,000 SF remains under construction, reflecting a significant decline from recent peak levels. Approximately 343,000 SF was delivered during the quarter, adding modest supply to a market already experiencing elevated vacancy. Limited land availability continues to restrict new development, reinforcing Orange County’s long-term supply-constrained characteristics. Recently completed speculative projects continue to compete through lower rents and increased concessions, particularly in larger building formats. As the construction pipeline continues to shrink, future supply pressures are expected to ease and support improving market fundamentals.
SF Construction Starts
Source: CoStar Group, Inc.
SF Under Construction
Source: CoStar Group, Inc.
Sales
Investment activity remained measured during the quarter, with $674 million in sales volume recorded. Pricing remained resilient at $349 per SF, while average cap rates held at 5.4%, reflecting relatively stable investor expectations despite elevated borrowing costs. Buyers continue to focus on well-located assets with long-term value potential, while owner-users remain an active source of demand. Institutional investment remains selective as capital markets continue to adjust to higher financing costs. Orange County’s limited industrial supply and strong long-term fundamentals continue to support investor interest despite a slower transaction environment.
Orange County Industrial Sales Volume
Source: CoStar Group, Inc.


