
Phoenix, AZ Retail Market Report Q2 2026
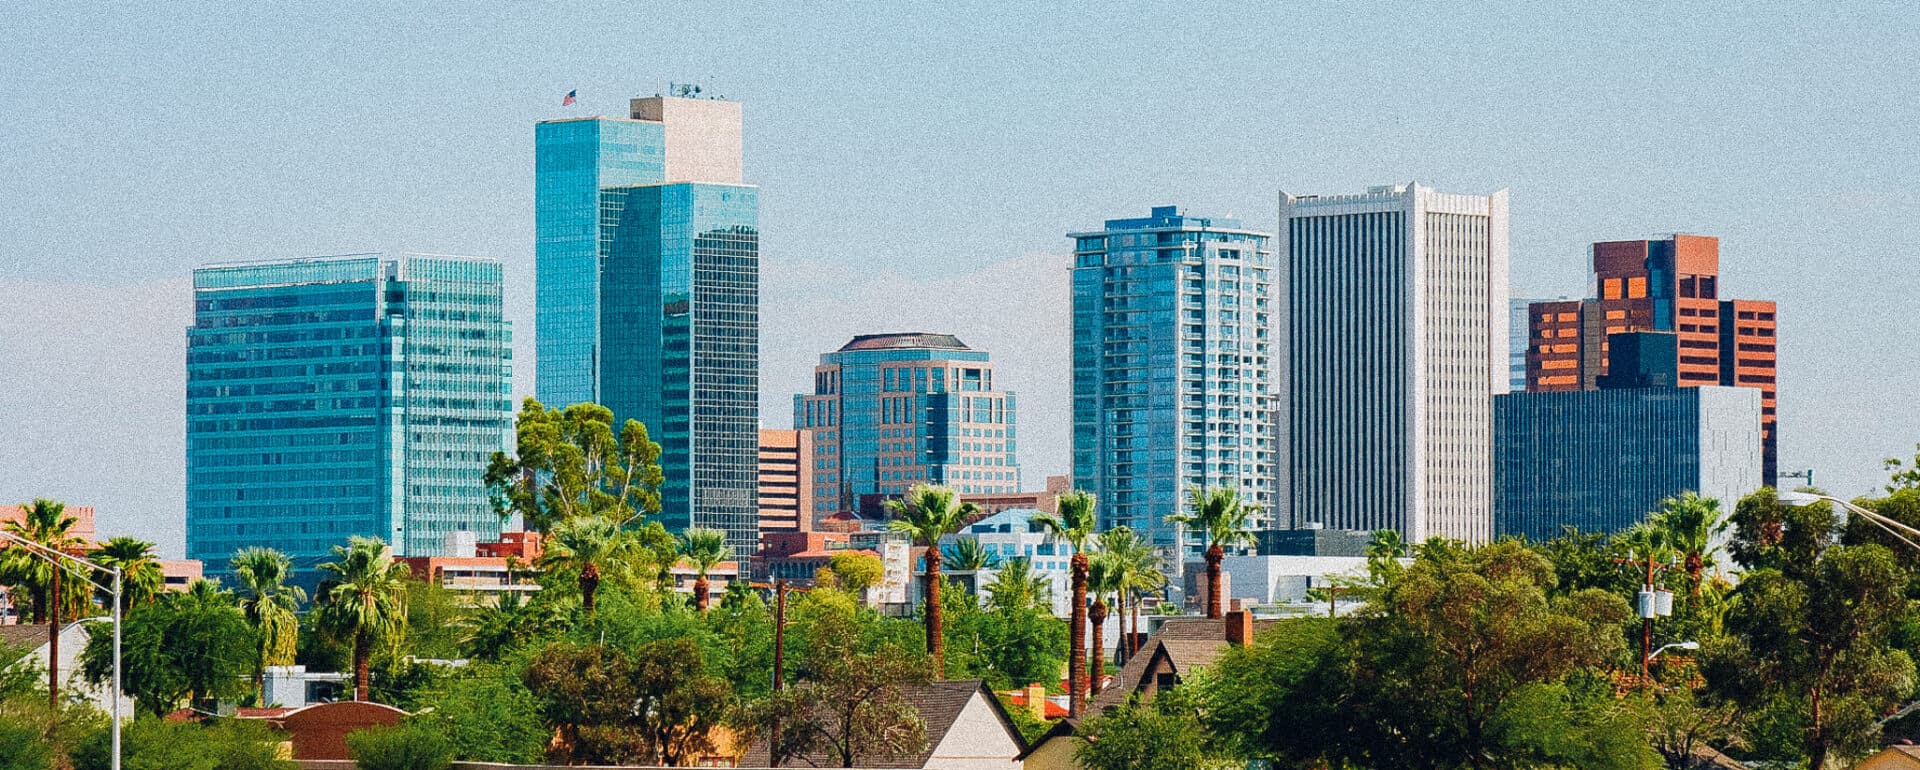
Phoenix’s retail fundamentals strengthened during the second quarter as tenant demand continued to keep pace with available inventory. Vacancy ended the quarter at 4.7%, reflecting limited availability across much of the market despite ongoing development. Leasing activity generated approximately 941,000 square feet of net absorption, underscoring the market’s ability to incorporate new space while maintaining stable occupancy. Average asking rents reached $27.20 per square foot, representing annual growth of 4.8%. Grocery-anchored centers, neighborhood retail, and projects located within high-growth suburban corridors continued to achieve the strongest leasing performance. Demand remained concentrated among necessity-based retailers, restaurants, medical users, and experiential concepts seeking locations near expanding residential communities. While some discretionary retailers have adopted a more measured expansion strategy, overall tenant activity has remained constructive. Limited existing inventory has allowed landlords to preserve pricing power across many submarkets. As a result, Phoenix continues to rank among the nation’s healthiest retail markets.

Key Findings
- Limited availability and sustained tenant interest kept Phoenix retail conditions tight, allowing landlords to maintain favorable leasing leverage.
- New deliveries were met by solid space demand, with absorption helping the market accommodate continued development without a material rise in vacancy.
- Transaction activity remained selective but steady, as buyers continued to prioritize well-located assets with durable income and long-term growth potential.
Phoenix Retail Supply & Demand Dynamics
Source: CoStar Group, Inc.
Phoenix Demographics
Source: Oxford Economics
- Unemployment Rate: 4.0%
- Current Population: 5,276,303
- Households: 2,013,678
- Median Household Income: $92,932
Phoenix continues to benefit from one of the nation’s strongest population and employment growth trajectories, providing a solid foundation for retail demand. Ongoing in-migration has expanded the consumer base, supporting spending across neighborhood, community, and regional retail centers. Employment gains remain diversified across healthcare, advanced manufacturing, logistics, professional services, and technology, helping sustain household income growth and consumer confidence. Major corporate expansions and continued investment in semiconductor manufacturing have reinforced the metro’s long-term economic outlook while attracting additional residents. Tourism and hospitality activity have also contributed to retail sales, particularly in entertainment and dining districts. Overall, Phoenix’s expanding economy continues to support healthy leasing demand and long-term retail investment.
Top Retail Leases in PHX
Source: CoStar Group, Inc.
- Verrado Marketplace: 520,000 SF
- Buckeye Commons: 411,411 SF
Population, Labor Force, & Income Growth
Annualized Rates of Growth | Source: Oxford Economics
Phoenix Retail Construction
Developers are responding to sustained population growth and expanding retail demand, as a result, keeping development activity elevated. Roughly 1.0 million square feet of retail space was delivered over the past year, while another 2.7 million square feet remained under construction. Much of the pipeline is concentrated within suburban growth corridors where new housing development is creating demand for neighborhood-serving retail. Grocery-anchored centers continue to account for a significant share of new construction, complemented by mixed-use projects that integrate retail with residential and office space. Preleasing activity has remained healthy for many new developments, limiting the amount of vacant space entering the market. Strong absorption has helped offset the impact of recent completions, allowing market fundamentals to remain balanced.
SF Construction Starts
Source: CoStar Group, Inc.
SF Under Construction
Source: CoStar Group, Inc.
Phoenix Retail Sales
Investor demand for Phoenix retail assets remained steady during the second quarter despite a more disciplined capital markets environment. Transaction volume reached approximately $616 million, illustrating continued liquidity for well-positioned properties. Assets traded at an average of $263 per square foot, while market cap rates averaged 7.0% as pricing continued to adjust to higher financing costs. Investors remained particularly interested in grocery-anchored centers and necessity-based retail assets that offer stable occupancy and dependable cash flow. Private capital has continued to drive much of the acquisition activity, although institutional buyers remain active in larger transactions. Bid-ask spreads have narrowed compared with prior quarters, helping facilitate additional deal flow. Buyers continue to emphasize assets located within high-growth submarkets supported by favorable demographics and long-term population expansion. Although pricing remains below peak-cycle levels, Phoenix continues to attract investment due to its resilient fundamentals and favorable long-term growth prospects. As capital markets stabilize, transaction activity is expected to gradually broaden across a wider range of retail property types.
Sales Volume
Source: CoStar Group, Inc.
By the Numbers
Q2 2026 | Source: CoStar Group, Inc.
- Sales Volume: $616M
- Price Per SF: $263
- Cap Rate: 7.0%
- Vacancy Rate: 4.7%
- Rent Growth: 4.8%
- Asking Rent Per SF: $27.20
- Under Construction: 2.7M SF
- SF Delivered: 1M
- SF Absorbed: 941K


