
South Florida Retail Market Report Q2 2026
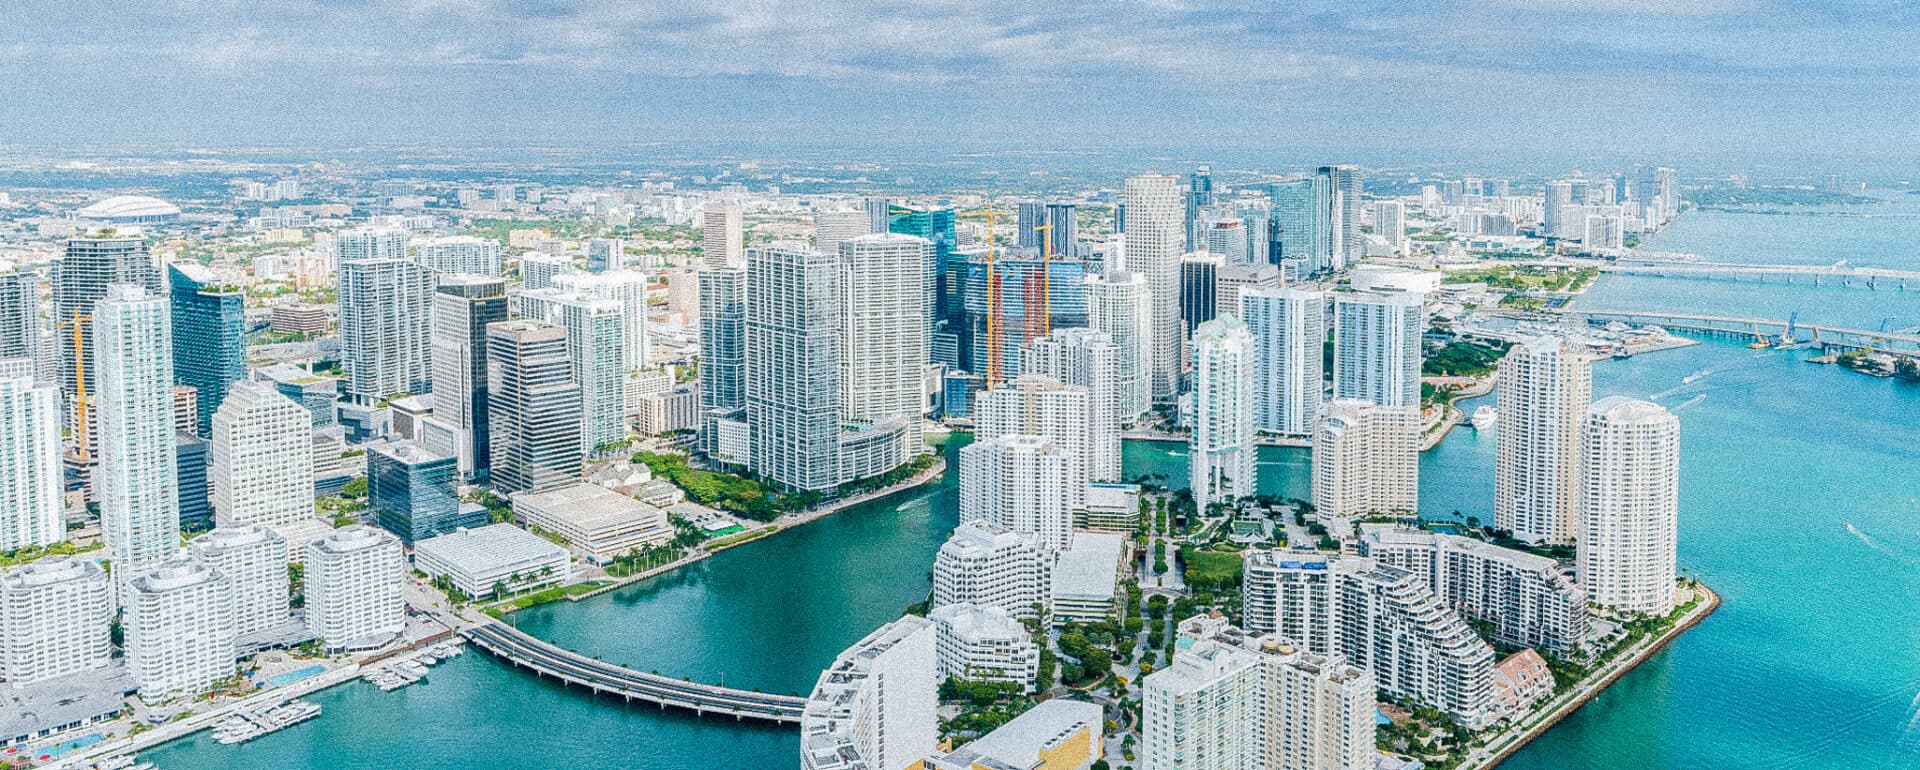
South Florida’s retail market (accounting for Miami, Fort Lauderdale, and Palm Beach) remains one of the strongest in the nation, supported by healthy tenant demand, limited available space, and continued investor confidence. The region recorded 508,000 square feet of positive net absorption, maintained a low 3.5% vacancy rate, and achieved 2.8% annual rent growth, with asking rents averaging $36.50 per square foot. Performance across the tri-county market remains well balanced, as Miami continues to lead leasing activity and attract institutional investment, Fort Lauderdale maintains stable occupancy despite a temporary slowdown in leasing, and Palm Beach stands out with some of the state’s strongest rent growth, fueled by exceptionally tight market conditions and constrained new supply.
Although higher interest rates and more measured consumer spending have tempered leasing and transaction activity from post-pandemic peaks, limited new development, steady population growth, and strong demographic fundamentals continue to support healthy occupancy, rent growth, and long-term investment demand throughout South Florida.

Market Overview
- Miami continued to lead the region with 404,000 square feet of positive net absorption, as a tight 3.3% vacancy rate and limited new supply sustained strong leasing fundamentals and investor demand.
- Fort Lauderdale maintained healthy market fundamentals despite a modest quarter of negative absorption, with 4.1% vacancy and continued investor interest supported by limited quality retail availability and stable pricing.
- Palm Beach remained the region’s strongest growth market, recording 201,000 square feet of positive absorption and 7.1% annual rent growth as constrained supply and limited vacancy continued to drive retailer competition.
South Florida By the Numbers
Source: CoStar Group, Inc.
- Sales Volume: $721M
- Price Per SF: $389
- Cap Rate: 6.5%
- Vacancy Rate: 3.5%
- Rent Growth: 2.8%
- Asking Rent Per SF: $36.50
- Under Construction: 2.4M SF
- Delivered: 211K SF
- Absorbed: 508K SF
South Florida’s economy continues to demonstrate resilience, supported by job creation and ongoing business investment. While elevated interest rates have moderated residential real estate activity and new development compared with the post-pandemic surge, demand for housing, office, industrial, and mixed-use projects remains above historical norms. The region continues to benefit from in-migration of businesses and high-income households, a robust tourism and hospitality sector, expanding healthcare and logistics industries, and its position as an international gateway for trade and finance. Although affordability challenges, higher borrowing costs, and labor constraints remain headwinds, South Florida’s diversified economy and favorable demographic trends continue to support long-term growth and investment across the tri-county market.
South Florida Retail Supply & Demand Dynamics
Miami, Fort Lauderdale, Palm Beach | Source: Oxford Economics
Miami Retail Posts 404K SF of Positive Absorption
Demand
The market recorded 404,000 square feet of positive net absorption, while the vacancy rate held at a tight 3.3%, reflecting continued competition for well-located retail space. Although leasing activity has moderated from the post-pandemic surge as retailers contend with higher operating costs and softer consumer spending, the market’s constrained availability continues to support stable occupancy and rent growth.
Rent Per SF vs Rent Growth
Source: CoStar Group, Inc.
Supply
Limited supply preserved the market’s landlord-favorable fundamentals. Just 48,700 square feet of retail space delivered during Q2, while 1.4 million square feet remains under construction, representing only about 1.0% of existing inventory. Much of the pipeline is already pre-leased and concentrated around major mixed-use developments such as Miami Freedom Park, suggesting that future deliveries should be absorbed without significantly increasing vacancy.
Completions vs Vacancy Rate
Source: CoStar Group, Inc.
Investing
Investment activity posted $277 million in retail sales volume and an average sale price of $442 per square foot. The market’s 5.8% average cap rate reflects continued investor demand for high-quality retail assets, particularly those in infill locations with strong demographics and limited new competition. While transaction activity has normalized from peak levels, Miami continues to attract institutional and private capital due to its long-term population growth, tourism-driven economy, and resilient retail fundamentals.
PPSF vs Cap Rate
Source: CoStar Group, Inc.
Investment Highlights
Volume
- $1.6B Training Twelve Month (TTM) volume, in line with 3-yr average
- Q2 volume at $277M, below recent quarterly highs
- TTM still shy of $2.6B peak in 2022
Pricing
- Cap rates at 5.8%, ~7-bps wide of 5.1% trough in 2022
- PPSF at $442, near cycle highs
- Brickell City Center trade set the bar at $1,367/SF
Fort Lauderdale Retail Holds 4.1% Vacancy Despite Slower Leasing
Demand
Market performance continued to demonstrate stability during Q2, although leasing demand softened as the market posted 72,500 SF of negative net absorption. Despite occupancy giving back some ground, vacancy remained a healthy 4.1%, reflecting the ongoing scarcity of quality retail space. Retailers remain focused on well-located neighborhood and grocery-anchored centers, while limited large-block availability continues to constrain expansion opportunities.
Rent Per SF vs Rent Growth
Source: CoStar Group, Inc.
Supply
Restrained development activity balanced market conditions. Just 28,400 SF of new retail space delivered during the quarter, while approximately 683,000 SF is under construction. The majority of the pipeline is concentrated in a handful of mixed-use projects, most notably Miramar Cove Lifestyle Center, with much of the space already committed before delivery. As a result, new construction is unlikely to materially alter market fundamentals over the near term.
Completions vs Vacancy Rate
Source: CoStar Group, Inc.
Investing
Investment remained active with $173 million in quarterly sales volume, as buyers continued to pursue stabilized assets in established trade areas. Average pricing held at $341 per SF, while cap rates averaged 6.1%, reflecting a market that continues to offer attractive yields relative to neighboring South Florida markets. Investors are drawn to Fort Lauderdale’s diverse consumer base, limited supply growth, and long-term demographic trends, even as transaction activity settles into a more normalized environment.
PPSF vs Cap Rate
Source: CoStar Group, Inc.
Investing Highlights
Volume
- $1.4 TTM volume, above the 5-year average of $1.2B
- Q2 volume at $173M, a step down from recent quarters
- Highest annual pace since 2022
Pricing
- Cap rates at 6.1%, within the 5.5%-6.5% range of the last five years
- PPSF at $342, near the market’s cycle-high pricing trends
- ~120 bps spread to the national avg 7.3% cap rate
Palm Beach Retail Rents Climb 7.1% On Constrained Supply
Demand
Palm Beach retail demand strengthened this quarter, with net absorption of 201,000 square feet, as improving leasing activity continued to outpace the market’s constrained pipeline. 3.7% vacancy kept available well below the market’s long-term average. With space at a premium, asking rents climbed to $38.98/SF, up 7.1% YOY. This is among the strongest growth rates in the state.
Rent Per SF vs Rent Growth
Source: CoStar Group, Inc.
Supply
The construction pipeline stayed thin, with roughly 127,000 square feet delivered this quarter and 402,000 square feet underway. Activity is spread across roughly 30 smaller projects, rather than one dominant development, led by Palm Beach County Outlying submarket’s Avenir Retail Building (under 50,000 SF, anchored by Publix). With 69.6% of the pipeline pre-leased, oversupply risk lowers, though elevated rates and land costs point to continued limited deliveries ahead.
Completions vs Vacancy Rate
Source: CoStar Group, Inc.
Investing
$207 million in retail traded this quarter, with pricing holding firm at $375 per square foot and cap rates averaging 6.0%. Private buyers continued to dominate the transaction landscape, though institutions picked up larger, single-asset deals selectively. With rents rising and space scarce, sellers are holding the line on pricing, and investors are showing little hesitation to invest in well-located Palm Beach retail assets.
PPSF vs Cap Rate
Source: CoStar Group, Inc.
Investment Highlights
Volume
- $1.5B TTM volume, above the 5-yr average of $1.1B
- Q2 volume at $207M, below previous quarters
- Roughly 280 transactions in the past 12 months
Pricing
- Cap rates at 6.0%, within 5.6%-6.7% range of the last five years
- PPSF at $375, tracking near cycle highs
- ~130 bps spread to 7.3% national cap rate avg


