

Northwest Atlanta Industrial Market Report H1 2026
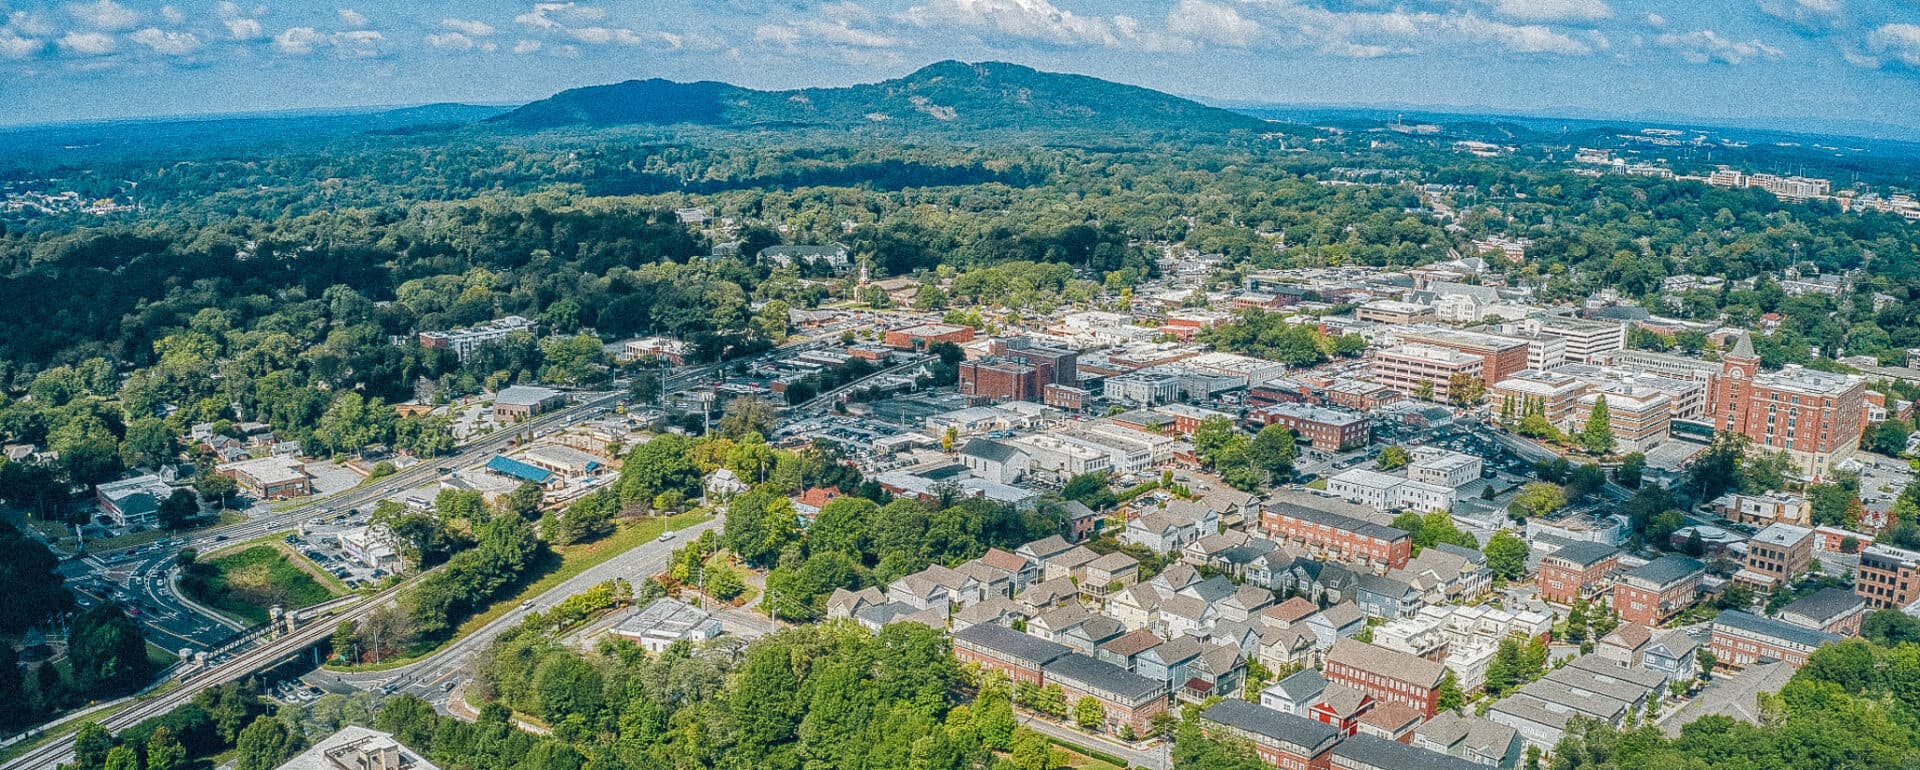
The Northwest Atlanta industrial market recorded an asking rent of $11.19 per square foot, representing 2.0% annual rent growth through the first half of 2026. Vacancy increased to 8.9% as recently completed developments added significant new inventory to the market. However, tenant demand remained healthy, with 3.3 million square feet of positive net absorption helping to offset much of the new supply entering the market. Leasing activity continued to be driven by third-party logistics providers, regional distributors, and manufacturing users seeking modern facilities with efficient transportation access. While elevated vacancy has provided tenants with greater negotiating leverage than in previous years, well-located Class A properties continue to attract interest. Rent growth has moderated from the rapid pace experienced during the market’s peak expansion but remains positive. Landlords have increasingly relied on concession packages to compete for larger tenants while maintaining relatively stable rents.
Key Findings
- Northwest Atlanta’s industrial market posted healthy fundamentals during the first half of 2026, with tenant demand continuing to support leasing activity despite higher vacancy driven by recent deliveries.
- Positive net absorption helped reduce the impact of a substantial wave of new supply, allowing market conditions to remain relatively balanced despite elevated vacancy.
- Investment activity reflected a more disciplined capital markets environment, with pricing and cap rates stabilizing as investors focused on high-quality industrial assets in strategic locations.
Northwest Atlanta Industrial Supply & Demand Dynamics
Source: CoStar Group, Inc.
Atlanta Demographics
Source: Oxford Economics
- Unemployment Rate: 3.6%
- Current Population: 6,543,559
- Households: 2,454,762
- Median Household Income: $84,921
Northwest Atlanta continues to benefit from the broader Atlanta metro’s diverse and expanding economy. The region remains a key distribution and logistics hub due to its strategic location, extensive interstate network, and access to Hartsfield-Jackson Atlanta International Airport. Population growth and business expansion have continued to support industrial demand, particularly among logistics providers, manufacturers, and e-commerce users. Employment gains across transportation, warehousing, professional services, and advanced manufacturing have reinforced leasing activity throughout the submarket. Companies continue to prioritize supply chain efficiency, supporting demand for modern warehouse and distribution facilities.
Top Industrial Leases in NW Atlanta
Source: CoStar Group, Inc.
- 7643 Hwy 140: 691,667 SF
- 981 Old Grassdale Rd NE: 526,400 SF
Population, Labor Force, & Income Growth
Annualized Rates of Growth | Source: Oxford Economics
NW Atlanta Construction
Approximately 3.9 million square feet of industrial space was delivered during the period, contributing to the increase in vacancy. Even with elevated deliveries, developers have become more selective as financing costs remain higher and speculative development has slowed. The market currently has approximately 748,000 square feet under construction, indicating a more measured pipeline moving forward. This slowdown in new starts should allow demand additional time to absorb recently completed inventory. Developers continue to focus on premier logistics locations with strong transportation connectivity and limited long-term land availability. Build-to-suit projects remain active as large occupiers seek customized facilities while minimizing speculative risk.
SF Construction Starts
Source: CoStar Group, Inc.
SF Under Construction
Source: CoStar Group, Inc.
NW Atlanta Industrial Sales
Industrial investment activity totaled approximately $331.5 million across 64 recorded transactions during the first half of 2026. Assets traded at an average price of $150.45 per square foot excluding one redevelopment land basis trade, with a median of $139.68. Average cap rates in the corridor sat near 7.1 percent on a market wide basis, illustrating relatively stable pricing as capital markets adjusted to higher borrowing costs.
Investor appetite was selective but unmistakably real. Off market sourcing accounted for 81 percent of tracked volume, a reminder that in a disciplined market the best risk adjusted entries are negotiated directly rather than won in a competitive process. Active buyers concentrated on well leased assets with credit quality tenants and several years of weighted average lease term remaining, and they underwrote vacancy risk conservatively given how expensive it is to carry empty space at current debt costs. Sale leaseback activity continued at a healthy clip as owner users chose to monetize equity trapped in their real estate, simultaneously freeing capital for their operating businesses and creating attractive off market deal flow across the Marietta, Kennesaw, and Acworth corridors.
Sales Volume
Source: CoStar Group, Inc.
NW Atlanta Industrial Leasing
The leasing market confirmed a two tier structure that closely mirrors the dynamics on the sale side. Newer, higher clear height Class A product held firm at the upper end of the asking range while older vintage space faced real pressure as tenants traded up whenever the rent gap allowed. The overwhelming majority of activity was structured triple net, which keeps the rent quoted to the tenant cleaner and pushes operating costs through to the occupant.
NW Atlanta Industrial Capital Markets
Two distinct pools of capital defined the half and they behaved in fundamentally different ways. Owner users, meaning operating businesses buying real estate to occupy themselves, accounted for nearly half the tracked deals and consistently paid up for turnkey functional move in ready product, concentrated along the Kennesaw and Acworth stretch of I 75 and in the affordability driven Pickens County market. Their bid is durable in a way purely financial capital is not, because it is driven by operational necessity rather than a required yield that rises and falls with interest rates.
Institutions and private equity approached the market through an entirely different lens, concentrating on scale, credit quality, and lease term, and they reengaged decisively through the portfolio and big box trades that dominated the top of the volume table. The structural point is that these two pools rarely competed for the same asset. Because their target sets did not overlap, pricing stayed orderly and rational across both segments rather than being distorted by mismatched competition.
PPSF vs 10-Year Treasury
Price per square foot held flat at $150 across the last three quarters even as the 10 year Treasury moved from 4.10% to 4.38%. Values are being supported by the supply picture rather than by the rate environment.
The Debt Environment
Commercial acquisition debt priced in the high 6 to low 7 percent range against going in yields in the high 6 to 7 percent area. When the cost of debt sits at or above the unlevered yield, leverage stops being accretive, and that single dynamic explains a great deal about which deals cleared this half and which sat. Assumable low rate debt appeared in several owner user transactions and often made the difference in a deal clearing.
By the Numbers
H1 2026 | Source: CoStar Group, Inc.
- Sales Volume: $227M
- Price Per SF: $137
- Cap Rate: 6.8%
- Vacancy Rate: 8.9%
- Rent Growth: 2.0%
- Asking Rent Per SF: $11.19
- SF Under Construction: 748K
- SF Delivered: 3.9M
- SF Absorbed: 3.3M

AuthorThomas Wilkinson
Associate Vice PresidentAtlanta, GA

AuthorHarrison Auerbach
Senior Vice President & DirectorAtlanta, GA


