Washington D.C. Retail Market Report Q2 2026
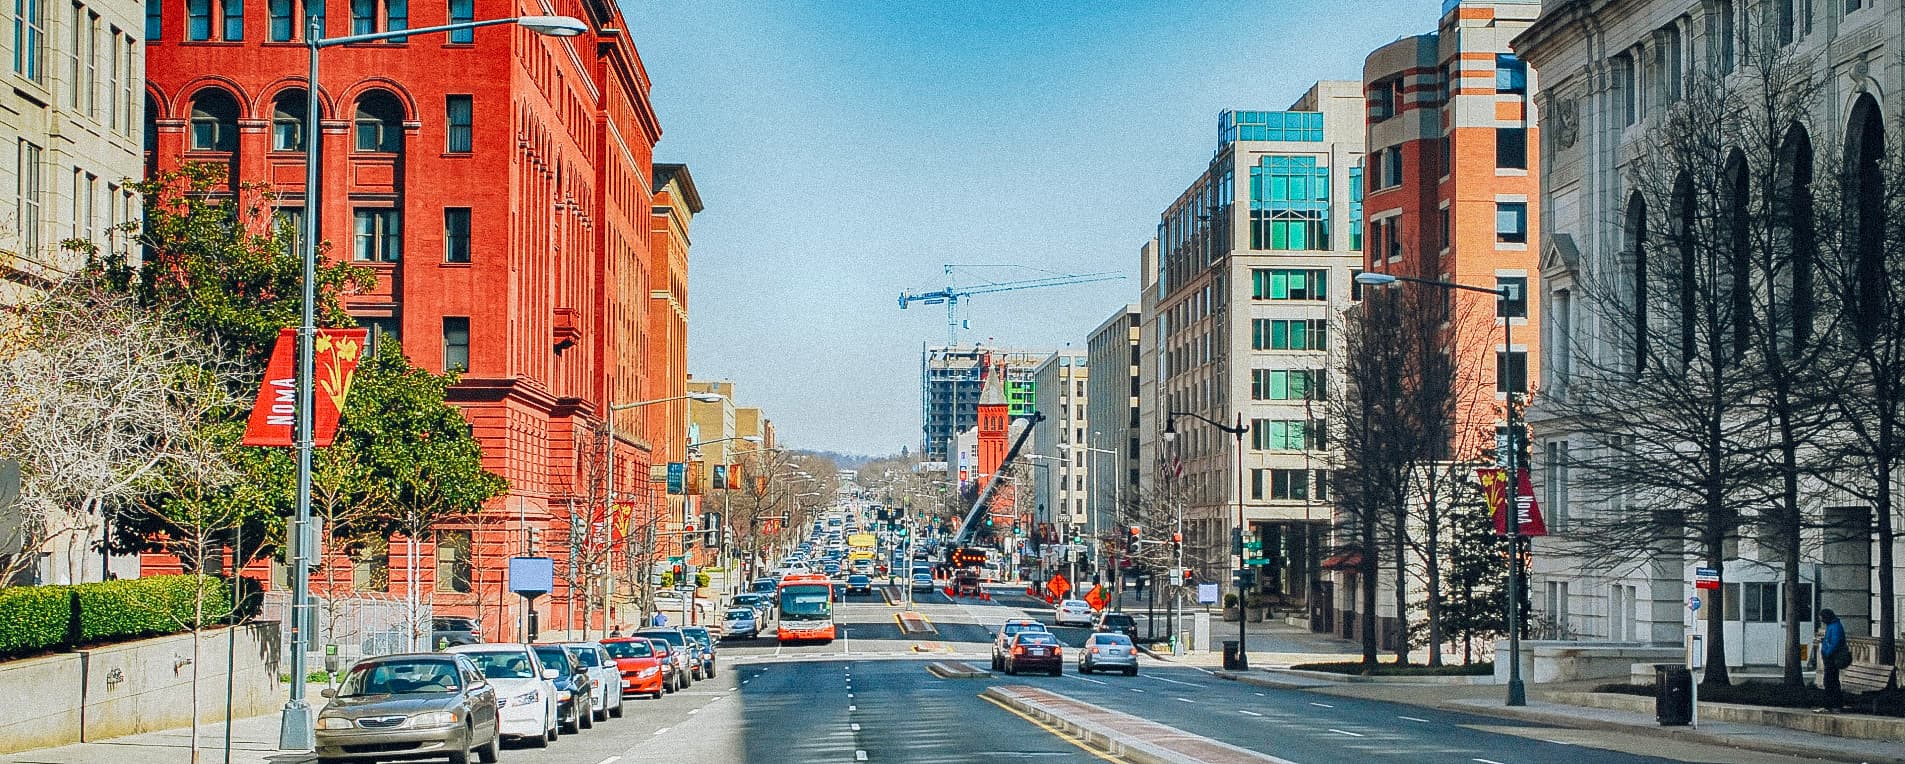
Washington, DC retail vacancy measured 4.5% in the second quarter, indicating that available space remained relatively limited despite modest occupancy losses. The market recorded negative net absorption of 76,000 square feet, signaling that move-outs and newly available space exceeded leasing-driven occupancy gains during the period. Negative absorption introduced some softness into quarterly fundamentals but did not translate into widespread vacancy pressure. Asking rents reached $35.47 per square foot and increased 3.2%, demonstrating that landlords retained pricing power despite the quarter’s occupancy decline. Limited availability in desirable retail nodes likely supported rent growth as tenants competed for well-positioned storefronts and shopping center space. Performance likely varied by location and property quality, with established trade areas and high-traffic centers better positioned to capture demand. Retailers also remain selective about footprints, placing greater emphasis on visibility, accessibility, surrounding demographics, and store-level profitability.
Key Findings
- Retail fundamentals showed mixed momentum as leasing demand supported rent growth while occupancy softened modestly during the quarter.
- The development pipeline stayed measured, limiting the risk of significant near-term supply pressure and helping preserve competitive conditions for existing properties.
- Investment activity demonstrated substantial capital interest, although elevated cap rates kept pricing disciplined and reinforced investor focus on asset quality and location.
Washington D.C. Retail Supply & Demand Dynamics
Source: CoStar Group, Inc.
Washington D.C. Demographics
Source: Oxford Economics
- Unemployment Rate: 4.1%
- Current Population: 6,495,981
- Households: 2,453,984
- Median Household Income: $128,743
The Washington, DC economy provided a relatively stable backdrop for the retail market during the second quarter, although uncertainty surrounding federal employment and government spending influenced the regional outlook. The market’s concentration of government, professional services, education, healthcare, and technology employment supports a broad consumer base across the District and surrounding suburbs. At the same time, changes in federal employment can have an outsized effect on household confidence and spending patterns throughout the region. Population density and high household incomes in many established neighborhoods support retailers that prioritize affluent and well-educated consumers. Tourism and business travel also contribute to retail spending, particularly in the District’s urban commercial corridors and destination-oriented locations.
Population, Labor Force, & income Growth
Annualized Rates of Growth | Source: Annualized Rates of Growth
Top Retail Leases in Washington D.C.
Source: CoStar Group, Inc.
- Enterprise Plaza: 181,271 SF
- Viva White Oak Town Center: 162,000 SF
Washington D.C. Retail Construction
Developers had 1.1 million square feet of retail space under construction at the end of the second quarter, including almost 500,000 square feet of new construction starts just this quarter. The pipeline represents a measured addition to the Washington, DC retail inventory and should limit the potential for broad supply-driven disruption. The quarter saw 137,000 square feet delivered, a relatively restrained pace of near-term completions. Much of the region’s development activity is likely to favor mixed-use projects and locations supported by dense residential populations, strong demographics, or expanding employment bases. Elevated construction costs and financing expenses also create barriers to speculative development and encourage developers to pursue projects with stronger leasing visibility.
SF Construction Starts
Source: CoStar Group, Inc.
SF Under Construction
Source: CoStar Group, Inc.
Washington D.C. Retail Sales
Washington, DC retail investment sales reflects substantial transaction activity in the market. Properties traded at an average price of $333 per square foot, providing a benchmark for investor valuations during the period. The average cap rate stood at 7.0%, reflecting a pricing environment shaped by financing costs, income expectations, and asset-specific risk. Higher required yields can create a wider pricing gap between buyers and sellers, particularly for properties with near-term leasing or capital expenditure requirements. Investors are likely placing greater emphasis on durable cash flow, tenant credit, lease term, and the long-term strength of individual trade areas. Grocery-anchored centers, necessity-oriented retail, and properties in affluent or densely populated locations may attract stronger demand because of their defensive income characteristics. Conversely, assets with elevated vacancy or uncertain tenant rollover can face greater underwriting scrutiny and higher return requirements. Transaction momentum through the remainder of 2026 will depend on interest rates, debt availability, seller expectations, and investors’ confidence in future retail income growth.
Sales Volume
Source: CoStar Group, Inc.
By the Numbers
Q2 2026 | Source: CoStar Group, Inc.
- Sales Volume: $568M
- Price Per SF: $333
- Cap Rate: 7.0%
- Vacancy Rate: 4.5%
- Rent Growth: 3.2%
- Asking Rent Per SF: $35.47
- Under Construction: 1.1M SF
- SF Delivered: 137K
- SF Absorbed: -76K